![]() Figures 1-20
Figures 1-20
![]() Figures
21-32
Figures
21-32
![]() Tables 1-14
Tables 1-14
Figure 1. Migrated multichannel seismic reflection profile Lusigal 12 across Site 898 at SP 3126.
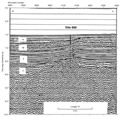
Figure 2. Multichannel seismic data and JOIDES Resolution Line 149-2 track chart.
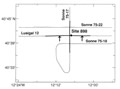
Figure 3. Migrated multichannel seismic profile Sonne Line 75-17.
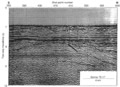
Figure 4. Distribution of the inclined reflector sequence.
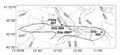
Figure 5. Summary lithologic column, Hole 898A.
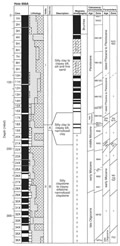
Figure 6. Regional stratigraphic correlation chart, Sites 897 to 900.
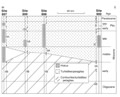
Figure 7. Sand and silt content in cores from Hole 898A.
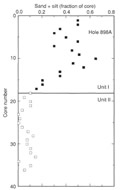
Figure 8. Depth vs. age curve for Site 898.
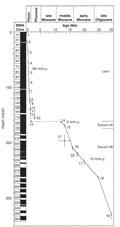
Figure 9. Core recovery vs. percentage of sand and silt in Unit I.
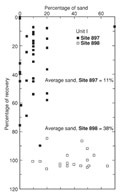
Figure 10. Two turbidites with sandy bases.
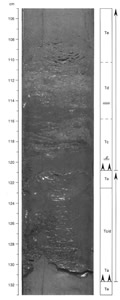
Figure 11. Turbidite sequence showing Bouma units Td and Te at the base.
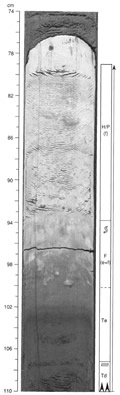
Figure 12. Content of siliceous allochems in dominant lithologies.
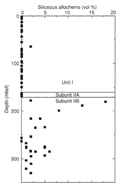
Figure 13. Irregular vertical variation within individual sequences.
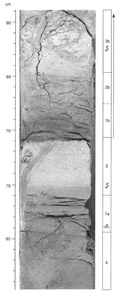
Figure 14. Massive or poorly laminated, sharp-based fine sandstone.
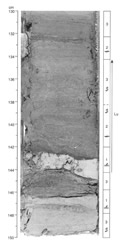
Figure 15. Bioturbated and cross-laminated calcareous, mixed terrigenous and biogenic fine sand layer.
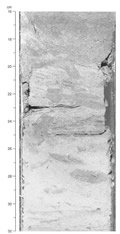
Figure 16. Magnetostratigraphy and planktonic microfossil zones.
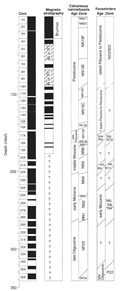
Figure 17. Magnetic inclination and declination for cores from Hole 898A.
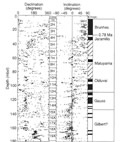
Figure 18. Downhole profile of magnetic susceptibility, Hole 898A.
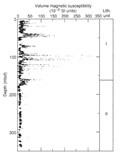
Figure 19. Organic carbon concentrations, Holes 898A and 898B.
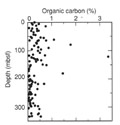
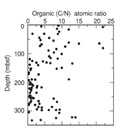
Figure 20. Organic C/N atomic ratios, Holes 898A and 898B.