 ,
,
We first discuss the potential causes of the curvature of the geothermal profile and then the lateral variation in heat flow along the transect.
If sedimentation occurs very rapidly with little interruption, it prevents the shallow sedimentary formation from achieving a steady thermal state. As a result, the conductive heat flow measured at a shallow sub-bottom depth can be significantly less than the actual geothermal heat flow entering from the bottom of the formation. The thermal effect of sedimentation can be evaluated through mathematical modeling if (1) the sediment accumulation history, (2) the thermal properties of the sediments, and (3) the history of heat input from the basement at the site have already been well constrained. The mathematical models proposed earlier solved the one-dimensional heat conduction equation for a semi-infinite solid with a moving surface boundary. (e.g., Von Herzen and Uyeda, 1963; Jaeger, 1965). More recent models account for the effects of the sediment compaction and the resultant vertical pore-fluid expulsion (e.g., Hutchison 1985). This study uses the latter approach in evaluating the thermal effect of sedimentation.
In the mathematical model, the sediment accumulation history must be constructed from the very beginning of the basin (Jurassic or Triassic?; Eberli, Swart, Malone et al., 1997). At Sites 1003 through 1007, recent sedimentation rates can be determined from the biostratigraphic data from the drill sites (Eberli, Swart, Malone, et al., 1997). Particularly, Sites 1003 and 1007 provide data from early Miocene to Holocene. We calculate the average sedimentation rate for each depth interval dated by microfossils. In doing so, we account for the effects of sediment compaction (e.g., Sclater and Christie, 1980). For older sediments that could not be reached by the drilling, we use the information available from the seismic reflection profiles along the drill sites (Eberli et al., 1994; Eberli, Swart, Malone, et al., 1997). The seismic data do not show the basement, but they penetrate to Mid-Cretaceous sequences that are ~1.5 km sub-bottom depth. We estimate the thickness of the earlier Mesozoic sequences to be ~1 km based on the seismic data from the neighboring Florida platform (Schlager et al., 1984). Thus, we use a total sediment thickness of 2.5 km in the model. We assume that the oldest sediment was deposited at 150 Ma. Knowing the thickness and the bottom age of the sedimentary layer, we obtain the average sedimentation rate for the old sediments and use it in the model. The simplification of accumulation history of old sediments affects the model result very little because it is the recent sedimentation history that controls the shallow thermal regime.
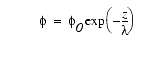
In modeling the compaction of sediments and their physical properties, we use the conventional, exponential compaction curve:
,
where ![]() is the porosity, z
is the sub-bottom depth,
is the porosity, z
is the sub-bottom depth, ![]() 0
is the porosity at seafloor, and
0
is the porosity at seafloor, and ![]() is a constant determined empirically. The thermal conductivity of the sediment
varies with porosity. We use the formula by Budiansky (1970) to calculate the
bulk sediment conductivity:
is a constant determined empirically. The thermal conductivity of the sediment
varies with porosity. We use the formula by Budiansky (1970) to calculate the
bulk sediment conductivity:
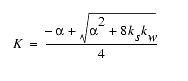 ,
,
where ![]() = 3
= 3 ![]() (ks
- kw)
+ kw
- 2ks,
with ks
and kw
being the sediment and water thermal conductivities, respectively. By
fitting the two equations to the physical properties measurements made during
Leg 166 (Eberli, Swart, Malone, et al., 1997) and the thermal conductivity
measurements made in this study (Table 1),
we determine
(ks
- kw)
+ kw
- 2ks,
with ks
and kw
being the sediment and water thermal conductivities, respectively. By
fitting the two equations to the physical properties measurements made during
Leg 166 (Eberli, Swart, Malone, et al., 1997) and the thermal conductivity
measurements made in this study (Table 1),
we determine ![]() 0
and
0
and ![]() for each site. Then, we calculate sedimentation rates using the depths corrected
for compaction. The real compaction curves are much more complex, but we believe
that the long-term trend is fairly well represented by our model.
for each site. Then, we calculate sedimentation rates using the depths corrected
for compaction. The real compaction curves are much more complex, but we believe
that the long-term trend is fairly well represented by our model.
Little information is available on the time variation of heat input from the basement. However, the choice of the basement heat-flow parameters does not have as large an impact on the model results as the other parameters (Hutchison, 1985). Rather than introducing too many unconstrained parameters, we simply assume that the basement heat input varied in time just like that of a typical oceanic lithosphere cooling (Parsons and Sclater, 1977) for the past 150 m.y. This results in basement heat-flow values that are similar to what we have observed (35-40 mW/m2).
Our model also accounts for radiogenic heat production within the sediments. We use a heat production rate of 0.66 µW/m3 for the solid component of the sediment, which was obtained from measurements made on lithified limestone samples from the Deep Sea Drilling Project Sites 535 and 540 off the Florida platform (Nagihara et al., 1996). The value is typical for limestones in general. In the model, the bulk heat production rate also varies with porosity.
The assumptions and the parameters defined above are incorporated into a finite-element model (Wang and Davis, 1992) and yield the thermal effect of sedimentation. This computation method is essentially the same as the algorithm of Hutchison (1985). Table 2 shows the model-predicted reduction in total heat flow because of the sedimentation effect. Probably, the estimates for Sites 1004, 1005, 1006 are less reliable than others because drill holes at these sites did not reach as deep. The model results show that reduction in heat flow is only 2%-3% for all sites. The effect is small, because the sedimentation rate rarely exceeded 100 m/m.y. for all the sites and for the entire period. Such rates are an order of magnitude smaller than those of typical clastic sedimentary basins. A few percent reduction in heat flow does not cause significant curvature in the geothermal profile, as shown in Figure 3 where we compare the actual geothermal profile with that predicted by the sedimentation model for Site 1004. Therefore, sedimentation is not the primary cause for the curvature in our temperature profiles in the shallow zones of sediments.
In a relatively porous carbonate platform such as the Great Bahama Bank, pore-water movement is possible. The pore-water chemistry data from Sites 1003 through 1007 core samples seem to indicate that seawater flows into the top layers of the sediments because a number of elements, particularly chloride, show uniform concentration values in the upper 20-50 mbsf (Eberli, Swart, Malone, et al., 1997). If there is influx of cold water into the formation, it can cause a concave upward geothermal profile (e.g., Bredehoeft and Papadopulos, 1965). Thus, it may explain some of our observations. For example, at Sites 1004 and 1005, this chemically inferred "flushed zone" is nearly 50 m thick. Site 1004 shows a concave-upward profile at depths shallower than 60 mbsf, though there are only three reliable measurements. At Site 1006, five temperature data points in the upper 60 mbsf also show a slight concave-upward feature.
At other sites, the correlation is not as good. There, the zone of nonlinear thermal profile extends much deeper than the chemically inferred flushed zone. At Site 1003, the flushed zone is ~50 m thick, whereas the slight concave feature in the temperature profile seems to reach 100 mbsf. At Site 1006, the chemically flushed zone is only 20 m thick, while the temperature profile shows a clear, concave-upward feature down to 100 mbsf. At Site 1007, the chemical flushed zone is ~20 m thick, while the temperature profile is concave downward in the top 50 mbsf and concave upward to ~120 mbsf.
The chemical diffusion coefficient of pore water is several orders of magnitude less than the thermal diffusivity. In other words, the chemistry data should be more sensitive to fluid movement than the thermal data. Vertical fluid movement could not perturb the geothermal profile without affecting the pore chemistry gradient, while the opposite may be possible. Thus, if there is influx of water from the seafloor, the chemical anomaly should extend deeper than the thermal anomaly. At Sites 1004 and 1005, the thickness of the flushed zone is about the same as that of the anomalous geothermal profile. It is possible that the thermal regime of these two sites is affected by fluid movement. At Sites 1006 and 1007, the zone of thermal anomaly is thicker than the chemically inferred flushed zone, opposite from the theoretical expectation. In Figure 4, we describe in detail the nature of the shallow thermal anomaly at Site 1006. In this plot, we show the temperature deviation from the linear trend observed at greater depths (>100 mbsf; see also Fig. 2). The temperature variation is systematic in the upper 100 mbsf. The amplitude of temperature deviation increases steadily with depth in the top 60 mbsf and then decreases gradually to zero at near 100 mbsf (Fig. 4). In contrast, the profile of the chloride concentration shows a typical diffusive characteristic in the same depth range, increasing with a near-constant rate. Therefore, the curvature of the geothermal profiles at Sites 1006 and 1007 cannot be explained by influx of seawater. The same can be said for Site 1003, though the thermal anomaly is significantly smaller than that of Sites 1006 and 1007.
We shall discuss now the third mechanism, long-term fluctuation of BWT, as a possible explanation for the curvature in the geothermal profiles. Even though a number of hydrographic measurements have been reported from this area (NOAA, 1994), no direct, long-term record of bottom-water temperature is available. However, more than 1°C of seasonal fluctuation has been reported at as deep as 600 mbsl (Niiler and Richardson, 1973). This depth is comparable to the seafloor depths of Site 1006 (669 mbsl) and Site 1007 (662 mbsl).
There may be significant interannual or interdecadal variation as well, but such a long-term trend is difficult to infer from the existing data because the hydrographic regime in the Straits of Florida is fairly complex (e.g., Leaman et al., 1995). The Site 1006-1007 area is where the Florida current, which loops around western Cuba, meets other tributary flows through the channels of Northwest Providence, Santaren, and Old Bahama. Together they form the Gulf Stream (Fig. 1). Water entering from the Santaren Channel is considerably warmer and more saline than the main Florida current. There is a large, horizontal thermal gradient in the east-west direction in the area of the drill sites. Even at 400-m water depth, there is a temperature difference of more than 8°C over the 80-km distance between the Florida peninsula and the Great Bahama Bank. Superimposed over this general trend is the large seasonal variation in the currents. Therefore, unless a series of hydrographic measurements are made at fixed locations very frequently for a decade or two, it would be impossible to recognize any long-term variation of the water temperature distribution in the Straits of Florida.
There is, however, strong evidence that the intermediate to deep water of the Gulf Stream, which originates from the Straits of Florida, has warmed up considerably in the last three decades (Roemmich and Wunsch, 1984; Levitus, 1989; Parrilla, et al., 1994; Levitus and Antonov, 1995). The warming is 0.2°-0.5°C at 400 mbsl. In addition, ground-surface temperature of the same region has shown significant, decadal-scale variation in annual mean temperature. For example, weather stations in Key West (location in Fig. 1) show a clear cooling trend in late 19th century and a steady warming trend throughout the 20th century (Fig. 5) (see Hanson and Maul, 1993). It is possible that such long-term climatic changes affect the BWT of the Straits because even short-term, seasonal fluctuations affect it.
Site 1006 offers the most detailed temperature profile and exhibits the concave-upward curvature most clearly. Assuming that this curvature is caused by a temporal variation in BWT, here we attempt to reconstruct the history by mathematical models and examine whether or not it could be conformable with other hydrographic and climatic observations. If BWT changes over time, the thermal signal slowly propagates to the subsea formation and is overprinted to the regional background geothermal gradient. Thus, if a detailed geothermal profile can be obtained from a borehole, the history of the BWT can be reconstructed theoretically by solving the inverse heat conduction problem (Wang, 1992). Inversion of borehole temperature data has been used on land and helped reconstruct the history of ground surface temperature for the past 100-200 years at over three hundred locations (e.g., Lachenbruch and Marshall, 1986; Pollack and Chapman, 1993; Deming, 1995).
We use a spectral inverse method based on the theory of one-dimensional heat conduction to reconstruct the BWT history at Site 1006. The inversion method was described by Wang (1992) and has been successfully applied to temperature data from land boreholes (Wang and Lewis, 1992; Wang et al., 1992; Kohl, 1998). Other methods for the same purpose are available (Shen and Beck, 1991; Beltrami and Mareschal, 1991), which yield similar results but differ in flexibility in incorporating a priori information as model constraints. Some detailed studies on data noise and model resolution can be found in Shen et al. (1995). In our calculation, the sub-bottom sediments are divided into seven layers, each having uniform thermal properties (Fig. 6). The diffusivities are estimated from the thermal conductivities assuming a volumetric specific heat capacity of 3.2 × 10⁶ J /m3K.
The inverse problem is ill posed, and a priori constraints are required for a stable and unique solution. Basic constraints on the unknown BWT are its smoothness and boundedness. We introduced these constraints probabilistically by regarding the a priori BWT time series as a stationary Gaussian process with a Hamming autocovariance function. The a priori standard deviation and autocorrelation scale of the BWT are assumed to be, respectively, 1°C and 50 years. We did not include mudline temperature data into our calculation because they may have been affected by drillwater circulation.
The estimated BWT history is shown in Figure 7 and the fit to the borehole temperature is shown in Figure 6 (solid line). In the early 18th century, the long-term average BWT (~8.2°C) was ~1°C lower than the present value. It slowly cooled down to a minimum at year ~1900, and then increased rapidly to the present temperature (~9.2°C). Readers should be reminded that the estimated BWT history is a smoothed one. It gradually loses temporal resolution as it looks further back in time. There might be large-magnitude, decade-scale variations prior to 100 or 200 years ago and the cooling could well be some rapid event(s), but the details cannot be resolved by geothermal data. The most reliable information in this reconstruction is (1) the long-term average in the past, (2) some cooling events up to year ~1900, and (3) the recent fast warming trend. One can in fact correlate each of these features directly to the curvature of the measured temperature profile. For example, the upward decrease in temperature relative to the steady-state reference profile results from the cooling trend, and the increase further up results from the recent warming.
We should refrain from making a direct inference about climate change and global warming from the geothermally determined BWT because of the complexity of the ocean-climate interaction. However, we cannot help but notice the resemblance of the BWT history to the surface air temperature (SAT) history recorded in nearby Key West weather stations, which shows a clear cooling event in late 19th century and a steady warming trend throughout the 20th century (Fig. 5; Hanson and Maul, 1993). Ground surface temperature (GST) histories determined from land boreholes in eastern Canada by Wang et al. (1992) and Wang and Lewis (1992) also show very similar variations (Note: Because of a plotting error, the GST histories illustrated in these two references should have been shifted backward in time by 30 years). They all suggest that the recent warming started around the turn of the century, though they differ in magnitude, ~1°C at Key West and Site 1006, and ~2°C in southeastern Canada.
Presently there is not enough information to determine whether or not the correlation between the BWT history of Site 1006 and the data from Key West and eastern Canada is purely fortuitous. It is also difficult to apply a similar BWT history to the geothermal data from other drill sites. We did not attempt to reconstruct their BWT histories, but it seems obvious because the curvature of Site 1007 is significantly different from that of Figure 7. Although there are many pieces of circumstantial evidence that support the BWT fluctuation as the primary cause of the curvature of the geothermal profile of Site 1006, no physical mechanism can be offered at this point to explain the difference in BWT histories between the drill sites. This is similar to the results from Leg 150, where Site 903 showed a clear concave-upward temperature profile, while Site 902, a short distance away, did not show such curvature (Mountain, Miller, Blum, et al., 1994).
As shown in Figure 8, the heat-flow values determined for Sites 1003 through 1007 seem to vary systematically with topography. Heat flow decreases inward of the Great Bahama Bank. The question here is whether this variation is associated with the seafloor topography or whether it reflects regional geothermal regime. Theoretical models on heat conduction show that topographic variation alone can affect subsurface temperature distribution (e.g., Birch, 1950; Blackwell et al., 1980). For example, if the surface temperature is uniform, a topographic depression causes a positive heat-flow anomaly, and vice versa. In the western margin of the Great Bahama Bank, seafloor elevation varies by ~660 m in a relatively short distance of 15 km. Temperature at the seafloor also varies with topography. We now attempt to quantify this effect.
In examining the topographic thermal effect, we use a simple method proposed by Blackwell et al. (1980). This method calculates the subsurface temperature distribution for a given set of surface temperature-surface elevation data, by applying a Fourier series fit in a fashion similar to the upward continuation problems in gravity and magnetics (Henderson and Cordell, 1971). It is possible to model the topographic effect in three dimensions; however, we believe a two-dimensional model along the east-west line should be adequate because this part of the Bahama platform edge is straight in the north-south direction and there is little bathymetric variation in the same direction. Sites 1003 through 1007 are located along a straight line in the southwest-northeast direction, whereas the shelf edge of the bank runs roughly north-south. Thus, in the two-dimensional model, we measure the distance between drill sites in the east-west direction, rather than along the transect line. The bathymetry of this area was previously surveyed in detail (Eberli, Swart, Malone, et al., 1997). We estimate the temperatures at the seafloor using the hydrographic data previously obtained in this part of the Straits of Florida (Leaman et al., 1995).
The modeling method of Blackwell et al. (1980) assumes that the geothermal field is in steady state. We have evaluated transient thermal effects such as sedimentation and BWT fluctuation separately from the topographic effect. We have also quantified the thermal effect of sedimentation (Table 2), and thus can estimate the heat flow without this effect. In addition, we have determined the background conductive heat flow at each site using only the temperature measurements in deep sediments free from the potential fluid flow and the BWT fluctuations. The model also assumes that subsurface thermal conductivity is uniform. The second assumption may cause errors because, in reality, thermal conductivity increases with depth because of compaction as we have discussed in modeling the thermal effect of sedimentation. More elaborate numerical methods may be used to account for this effect, if the thermal conductivity structure of the platform is better constrained. Direct conductivity measurements are available only from the five drill sites that extend to 400-1300 mbsf.
Figure 8 compares the heat-flow values at each drill site and the heat-flow variation predicted by the model. It assumes a uniform background heat flow of 43 mW/m2 and a thermal conductivity of 1.25 W/(m·K). We also examined the model for thermal conductivity values of 1.0 W/(m·K) and 1.5 W/(m·K) and obtained almost identical results for the same background heat-flow value. The general shape of the model-predicted heat-flow variation matches that of the observed. It shows a peak near the foot of the bank and heat-flow decreases up slope. Thus, the topographic thermal effect can account for the general trend of heat-flow variation and its magnitude. However, on the bank slope, the observed heat-flow values are 5-10 mW/m2 less than predicted. There are two possible explanations. The first is that the geometry, the assumed seafloor temperatures, and/or the thermal conductivity structure of the model contain errors. Adjusting these parameters would eventually reproduce the observed heat-flow variation without changing the background heat flow. The second is that the background heat flow of the study area varies laterally. In other words, the topographic effect alone cannot explain the observed heat-flow variation even if all other model parameters could be more tightly constrained.
Provided with data from only five locations along one transect of 20 km, it is difficult to further discuss this matter. We are inclined to accept the first explanation because of the similarity of the shape of the model-predicted and the observed heat-flow variation along the transect. In addition, the background heat flow of 43 mW/m2 away from the bank is close to those reported in the abyssal plain of the Gulf of Mexico (41-45 mW/m2; Nagihara et al., 1996), which is the basin in the opposite side of the Florida platform. The values are reasonable for old continental margins of Jurassic age. The magnitude of the decrease in heat flow (10-15 mW/m2 drop within a short distance of ~15 km) may be difficult to explain by any tectonic mechanisms associated with the ocean continent transition and/or the difference in the amount of initial continental extension. However, there is no other strong evidence for rejecting spatially variable heat flow.
![]()