![]() Figures F1-F11
Figures F1-F11
![]() Tables
T1-T6
Tables
T1-T6
F1. Location maps.
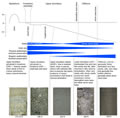
F2. Nearshore sedimentation model.
F3. Sequence boundaries.
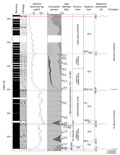
F4. Stratigraphic summary, Omar Formation.
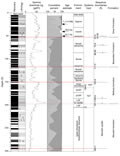
F5. Stratigraphic summary, lower Manokin formation.
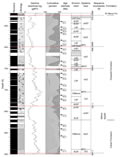
F6. Stratigraphic summary, Choptank Formation.
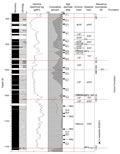
F7. Stratigraphic summary, middle Calvert Formation.
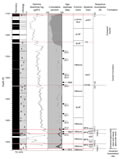
F8. Stratigraphic summary, lower Calvert Formation.
F9. Pollen and dinocysts.
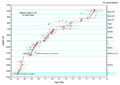
F10. Age-depth plot.
F11. Age comparison.
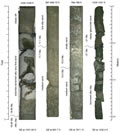
T1. Core descriptions.
T2. Data used to construct the cumulative percent lots.
T3. Sr isotopic data.
T4. Foraminiferal occurrences.
T5. Fossil occurrences.
T6. Sedimentation rates.