![]() Figures
F1-F11
Figures
F1-F11
![]() Tables T1-T10
Tables T1-T10
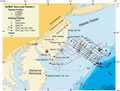
F1. Location map.
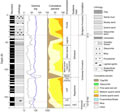
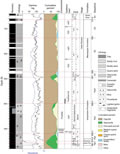
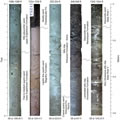
F2. Bridgeton and Cohansey stratigraphic section.
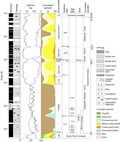
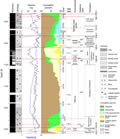
F3. Wildwood, Brigantine, and Shiloh Marl stratigraphic section.
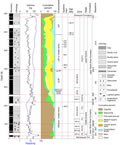
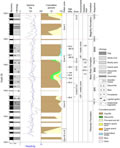
F4. Shark River stratigraphic section.
F5. Manasquan, Vincentown, and Hornerstown stratigraphic section.
F6. New Egypt, Navesink, Mount Laurel, etc. stratigraphic section.
F7. Magothy, Bass River, and Potomac stratigraphic section.
F8. Lithologic units and aquifers correlation.
F9. Representative sequence boundaries.
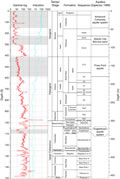
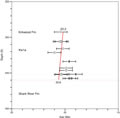
F10. Miocene age depth plot.
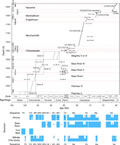
F11. Cretaceous age depth plot.
T1. Core descriptions.
T2. Data used to construct cumulative percent logs.
T3. Cenozoic planktonic foraminiferal occurrences.
T4. Cenozoic benthic foraminiferal occurrences.
T5. K/P boundary planktonic foraminiferal occurrences.
T6. K/P boundary benthic foraminiferal occurrences.
T7. Campanian–Santonian foraminiferal occurrences.
T8. Cenomanian–Turonian foraminiferal occurrences.
T9. Pollen and dinocyst occurrences.
T10. Sr isotopic data.