![]() Figures
F1-F11
Figures
F1-F11
![]() Tables
T1-T4
Tables
T1-T4
![]() Appendix Figure AF1
Appendix Figure AF1
F1. Drillsite locations.
F2. Stratigraphic section, Cape May Formation.
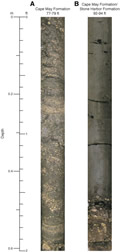
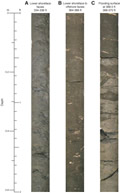
F3. Representative lithofacies, Cape May Formation.
F4. Stratigraphic section, Stone Harbor Formation.
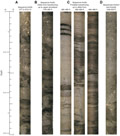
F5. Representative lithofacies, Stone Harbor Formation.
F6. Stratigraphic section, Cohansey and Kirkwood Formations.
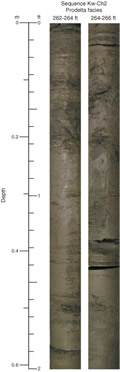
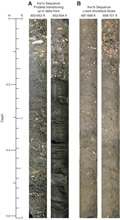
F7. Prodelta facies.
F8. Stratigraphic section, Belleplain Member.
F9. Representative lithofacies, Sequence Kw3.
F10. Stratigraphic section, Wildwood Member.
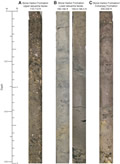
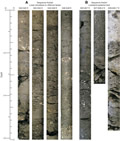
F11. Representative lithofacies, Sequences Kw2a and Kw2b.
F12. Representative lithofacies, Sequence Kw2a.
F13. Stratigraphic section, Shiloh Marl Member.
F14. Representative lithofacies, Sequences Kw1c and Kw1b.
F15. Age-depth plot.
F16. Mean D/L values, Mulinia and Mercenaria.

F17. Mean D/L values, Mercenaria.

F18. Dip section.
F19. Terminology.
T1. Core descriptions.
T2. Diatom occurrences.
T3. Sr isotope data.
T4. Amino acid analyses data.
AF1. Cape May Zoo, Cape May, and Ocean View coreholes.

![]() Figures
F1-F11
Figures
F1-F11
![]() Tables
T1-T4
Tables
T1-T4
![]() Appendix
Figure AF1
Appendix
Figure AF1