![]() Figures F1-F14
Figures F1-F14
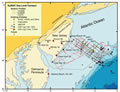
F1. Location map for the NJ/MAT Sea-Level Transect.
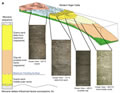
F2. Facies models.
F3. Comparison of Bethany Beach borehole with NJ sequence ages.
F4. Backstripped R2 eustatic estimates.
F5. Age-depth plots for Bass River and Ancora.
F6. Estimate of eustatic changes.
F7. Cenomanian-Turonian section at Bass River, NJ.
F8. Maastrichtian events at Bass River, NJ.
F9. Cretaceous/Tertiary (K/T) boundary at Bass River, NJ.
F10. Paleocene/Eocene boundary from Bass River, NJ.
F11. Summary for Bass River, NJ.

F12. Summary for Ancora, NJ.

F13. Summary for Ocean View, NJ.
F14. Summary for Bethany Beach, DE.
