![]() Figures F1-F31
Figures F1-F31
![]() Tables
T1-T16
Tables
T1-T16
F1. Map showing Site 1132 in relation to other Leg 182 sites and the AGSO169 seismic lines.
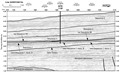
F2. Portion of seismic Line AGSO169/13a showing seismic stratigraphic sequences at Site 1132.
F3. Site 1132 summary of lithostratigraphy.
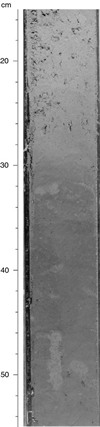
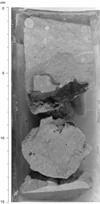
F4. Firmground that marks the boundary between Subunits IIIB and IIIC.
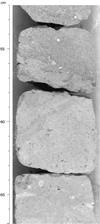
F5. Bioclastic grainstone from the basal part of Unit V.
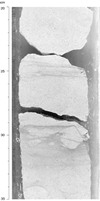
F6. Hardground marking the top of Unit VI.
F7. Unit VI burrowed firmground to hardground.
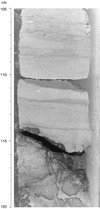
F8. Unit VI complex mineralized hardground in bioclastic packstone.
F9. Calcareous nannofossil and planktonic foraminifer zones, with benthic foraminiferal assemblages.
F10. Sedimentation rate curve from datum levels for Site 1132.
F11. Magnetic intensity in Hole 1132B from 0 to 250 mbsf.
F12. Magnetic susceptibility and intensity of magnetization in Hole 1132B from 0 to 250 mbsf.
F13. Magnetic inclination and magnetostratigraphy.
F14. CaCO3 and Corg contents in samples from Hole 1132B.
F15. Concentration depth profiles.
F16. Concentration depth profiles.
F17. Concentration depth profiles.
F18. Salinity vs. absolute depth.
F19. Variations in mineral concentrations.
F20. P-wave velocity, bulk density, porosity, NGR, and magnetic susceptibility for Site 1132.
F21. Shear strength data.
F22. Thermal conductivity and bulk density data.
F23. Variation of formation temperature with depth below seafloor.
F24. Logging runs at Hole 1132C.
F25. Geophysical logs from the triple combo, plotted vs. depth in the open-hole logged interval.
F26. Spectral gamma-ray logs, plotted vs. depth for the open-hole logged interval.
F27. Spectral gamma-ray logs, plotted vs. depth for the interval logged through pipe.
F28. Seismic site-survey tracks for Site 1132 in relation to other Leg 182 sites and the AGSO169 site-survey seismic lines.
F29. Portion of seismic Line AGSO169/13a showing seismic stratigraphic sequences.
F30. Predicted and corrected depths and interval velocities.
F31. Lithostratigraphic units, seismic sequences, biostratigraphic hiatuses, and ages.
T1. Site 1132 coring summary.
T2. Datum levels used in the graph of sedimentation rate.
T3. Headspace gas compositions, Holes 1132B and 1132C.
T4. CaCO3, Corg, N, and S data, Hole 1132B.
T5. Interstitial water geochemistry.
T6. Mineralogical composition data.
T7. Discrete P-wave velocity measurements.
T8. GRA-densiometry measurements.
T9. Magnetic susceptibility measurements.
T10. Natural gamma-ray measurements.
T11. Thermal conductivity measurements.
T12. In situ temperature measurements.
T13. Index properties measurements.
T14. Undrained shear strength measurements.
T15. P-wave velocity measurements from the MST.
T16. Differences between depths to key horizons and corrected depths.