![]() Figures F1-F20
Figures F1-F20
![]() Figures
F21-F40
Figures
F21-F40
![]() Figures
F41-F60
Figures
F41-F60
![]() Figures
F61-F80
Figures
F61-F80
![]() Figures
F81-F100
Figures
F81-F100
![]() Tables
T1-T19
Tables
T1-T19
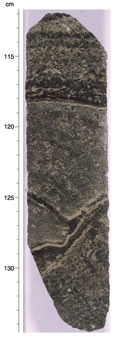
F81. Close-up photograph of Sample 183-1139A-73R-2 (Piece 12, 112-134 cm).
F82. Net mass gain or loss of rock components from the most highly altered intervals.
F83. AF demagnetization of a discrete sediment sample.
F84. Inclination, intensity, and susceptibility of sediments.
F85. Average intensity and susceptibility of all units.
F86. Inclination, intensity, and susceptibility of basement rocks,.
F87. Directional anisotropy data from Unit 7.
F88. AF demagnetization of a basement archive half.
F89. Thermal demagnetization of discrete basement samples.
F90. Downhole physical properties and compressional wave velocities.
F91. Downhole physical properties profiles of basement Units 2-19,.
F92. Downhole profiles of MST measurements along with discrete measurements.
F93. Downhole profile of whole-core measurements of thermal conductivity on whole-core soft sediments and on split-core pieces of hard rocks.
F94. Comparison of densities determined from core samples and GRAPE and Vp from downhole logs and core samples.
F95. Composite of core recovery, depth, curated stratigraphy, age, lithology, density and velocity.
F96. Seismic reflection data and a synthetic seismic trace.
F97. Overview of the logging data.
F98. Comparison of core and log measurements to assess log quality.
F99. Correlation of core lithology and logging results.
F100. Temperatures measured by the LDEO TAP tool show a different temperature gradient in the basement than in the overlying sediments.
![]() Figures F1-F20
Figures F1-F20
![]() Figures
F21-F40
Figures
F21-F40
![]() Figures
F41-F60
Figures
F41-F60
![]() Figures
F61-F80
Figures
F61-F80
![]() Figures
F81-F100
Figures
F81-F100
![]() Tables
T1-T19
Tables
T1-T19