![]() Figures
F1-F6
Figures
F1-F6
![]() Tables T1-T5
Tables T1-T5
F1. Location of Leg 184 sites.
F2. Samples used for this study.
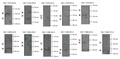
F3. Diffractograms of two samples.
F4. Distribution of volcanic ash layers and GCLs in the SCS.
F5. Oxygen isotopes and neotectonics vs. GCL intervals.
![]()
F6. Autocorrelogram of GCL intervals, Site 1148.
T1. Location of Sites 1143-1148.
T2. Depths and ages for GCLs.
T3. Physical and chemical data.
T4. XRF and Rock-Eval data.
T5. Poisson distribution of GCLs.