![]() Figures F1-F50
Figures F1-F50
![]() Figures
F51-F89
Figures
F51-F89
![]() Tables
T1-T18
Tables
T1-T18
![]() Table
AT1
Table
AT1
F1. Bathymetry of the Prydz Bay region.
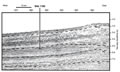
F2. Seismic section showing Reflectors PP12, P3, P2, and P1.
F3. Presite survey track line.
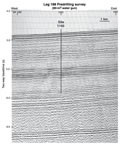
F4. Predrilling seismic survey.
F5. Lithostratigraphic subdivision.
F6. Composite stratigraphic section.
F7. Graphic logs illustrating facies associations.
F8. Diatom clay (Facies I-2) in Unit I.
F9. Silt laminae and stringers in Unit I.
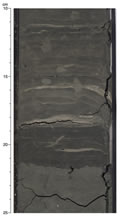
F10. Injection structure and abrupt color changes in Unit I.
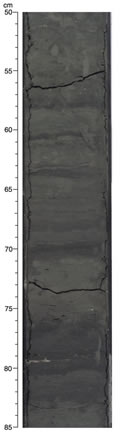
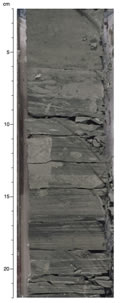
F11. Color banding and planar lamination in Unit II.
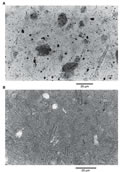
F12. Photomicrographs of dark gray diatom-bearing clay and greenish gray diatom clay.
F13. Thick calcareous bed within Subunit IIB.
F14. Planar silt laminae within Subunit IIIC.
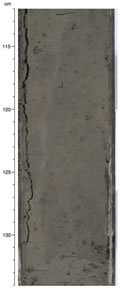
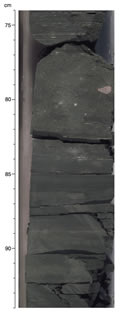
F15. Greenish gray claystone (Facies III-2) of Unit III.
F16. Dark gray claystone (Facies III-1) of Unit III.
F17. Silt within dark gray claystone (Facies III-1) of Unit III.
F18. Deformed interval within Unit III.
F19. Benthic foraminifers and rip-up clasts (Facies III-2) of Unit III.
F20. Well-preserved trace fossil in claystone of Unit III.
F21. Burrows and Zoophycos trace fossils from Unit III.
F22. Photomicrograph of metamorphic rock fragments in Unit III claystone.
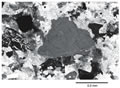
F23. Lonestones within greenish gray beds of Unit III.
F24. X-ray diffractograms of clay-sized fractions of sediment from Hole 1165B.
F25. X-ray diffractograms of clay-sized fractions of sediment from Hole 1165C.
F26. Downhole abundance of terrigenous debris in the >125-µm grain-size fraction.
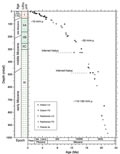
F27. Age-depth plot for the composite section represented by Holes 1165B and 1165C.
F28. Core recovery, lithologic units, magnetostratigraphy, and biostratigraphic zones for Hole 1165B.
F29. Core recovery, lithologic units, magnetostratigraphy, and biostratigraphic zones for Hole 1165C.
F30. Age-depth model.
F31. Downcore variation of concentration-dependent parameters.
F32. Thermal demagnetization of a composite three-axis IRM for two representative samples.
F33. Plot of IRM acquisition and DC demagnetization of seven representative samples.
F34. Inclination record (0-999.1 mbsf) after demagnetization at 20-30 mT.
F35. Vector component diagram of demagnetization (AF) behavior of representative samples.
F36. Magnetostratigraphic record (0-50 mbsf).
F37. Magnetostratigraphic record (50-100 mbsf).
F38. Coincidence between the intensity of remanence and polarity changes with lithology changes in Core 188-1165B-11H.
F39. Magnetostratigraphic record (350-650 mbsf).
F40. Magnetostratigraphic record (500.0-999.1 mbsf).
F41. The relative paleointensity record (susceptibility normalization) for the uppermost 100 m.
F42. Selected high-resolution interstitial water chemistry profiles vs. depth.
F43. Full interstitial water chemistry profiles vs. depth.
F44. Downhole profiles of dissolved sulfate and headspace methane for the upper 400 m.
F45. Sulfate vs. alkalinity.
F46. Observed calcium depletion vs. predicted calcium depletion within the SRZ.
F47. Calcium vs. magnesium.
F48. Interstitial water potassium concentrations vs. semiquantitative K-feldspar distribution from XRD analyses.
F49. C1, C2, and C3 vs. depth.
F50. C1/C2 values of headspace gas vs. depth.
![]() Figures F1-50
Figures F1-50
![]() Figures
F51-F89
Figures
F51-F89
![]() Tables
T1-T18
Tables
T1-T18
![]() Table
AT1
Table
AT1