![]() Figures F1-F50
Figures F1-F50
![]() Figures
F51-F89
Figures
F51-F89
![]() Tables
T1-T18
Tables
T1-T18
![]() Table
AT1
Table
AT1
F51. C1/C2 values of headspace gas vs. sediment temperature.
F52. Recalculated concentration of methane dissolved in pore water.
F53. Weight percent of inorganic carbon (carbonate carbon) and organic carbon in sediments.
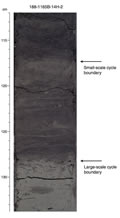
F54. Example showing color cycles.
F55. Example of the boundary of a large-scale cycle.
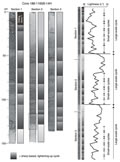
F56. Lightness and GRA bulk density and a cross spectra of the L* and density measurements for 83-100 mbsf.
F57. Lightness and GRA bulk density and a cross spectra of the L* and density measurements for 107-123 mbsf.
F58. Spectral analyses on lightness values.
F59. MS, GRA bulk density, P-wave velocity, and NGR measurements from Hole 1165B.
F60. PWL and PWS velocity data vs. depth.
F61. Bulk mineralogy from XRD, NGR, and binned natural gamma spectra vs. depth.
F62. MS, GRA bulk density, and lightness measurements on Cores 188-1165B-14H and 15H.
F63. Grain density and porosity from discrete measurements.
F64. Bulk density and dry density from discrete measurements.
F65. Water content and void ratio from discrete measurements.
F66. GRA bulk-density data vs. bulk density from discrete measurements and ratio of discrete measurement of bulk density to bulk density from GRA measurements.
F67. Calculated overburden pressure based on discrete measurements vs. that from GRA data.
F68. Discrete velocity measurements obtained with the PWS.
F69. Measurements of undrained shear strength using the AVS, FC, and PP.
F70. Normalization of undrained shear strength with respect to effective overburden pressure.
F71. Measurements of thermal conductivity.
F72. Measured temperature vs. time from deployment of the Adara tool for Core 188-1165B-4H.
F73. Measured temperature vs. time from deployment of the Adara tool for Core 188-1165B-10H.
F74. Measured temperature vs. time from deployment of the Adara tool for Core 188-1165B-14H.
F75. Measured and estimated temperature vs. depth profile.
F76. Logging summary diagram.
F77. Gamma-ray, density, porosity, resistivity, and sonic velocity logs.
F78. HSGR, uranium, thorium, potassium, and PEF logs.
F79. Comparison of HSGR log (downhole) and core gamma-ray values (adjusted).
F80. Expanded sections from logging Units 2 and 3.
F81. Comparison of MAD bulk density and log bulk density.
F82. Comparison of z-direction core P-wave velocity measurements and log P-wave velocity.
F83. Comparison of z-direction core P-wave velocities and P-wave velocity derived from the density-porosity log values.
F84. Wavelet used to produce a synthetic seismogram.
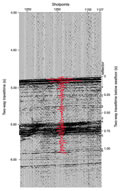
F85. Synthetic seismogram for shale fraction = 0.5, overlain on the site survey profile.
F86. Comparison of x-direction core P-wave velocities and P-wave velocity derived from the density-derived porosity.
F87. Synthetic seismogram wave trace placed on a depth axis.
F88. Reflection coefficient log on both traveltime and depth axes.
F89. Downhole temperature from the TAP tool.
T1. Coring summary.
T2. Expanded coring summary.
T3. Facies description and characteristics.
T4. Lonestone content of different-colored facies from X-radiographs.
T5. Summary of diatom datums identified, Holes 1165B and 1165C.
T6. Summary of diatom and radiolarian biostratigraphic datums recognized in Holes 1165B and 1165C.
T7. Interstitial water chemistry from shipboard measurements.
T8. Headspace gas concentrations of C1, C2, and C3.
T9. Recalculation of headspace gas CH4 concentrations.
T10. Carbon, nitrogen, and sulfur analyses of sediments.
T11. Organic carbon and Rock-Eval pyrolysis on selected samples.
T12. Discrete P-wave measurements.
T13. Undrained shear strength measurements.
T14. Thermal conductivity measurements for APC and XCB cores using full-space needle.
T15. Thermal conductivity measurements for RCB cores using half-space needle.
T16. Measured and estimated temperatures, geothermal gradients, and heat-flow estimations.
T17. Logging operations summary, Hole 1165C.
T18. Correlation of density, resistivity, and PEF peaks observed in the downhole logs to carbonate-cemented intervals in the cores.
AT1. Accessory components identified in foraminiferal residues.