![]() Figures F1-F26
Figures F1-F26
![]() Tables
T1-T4
Tables
T1-T4
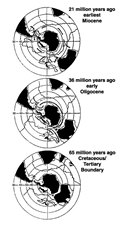
F1. Antarctica and surrounding continents at the K/T boundary showing the development of Antarctic Circumpolar Current circulation.
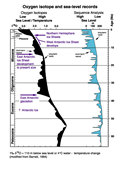
F2. Global sea level, tectonism, and ice volume.
F3. Bathymetry of the offshore Tasmanian region.
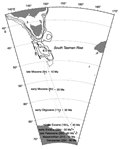
F4. Trajectory of the South Tasman Rise with respect to Antarctica
F5. Plate tectonic setting of the Tasmanian region within Gondwana during the earliest Late Cretaceous.
F6. Paleogeographic map of Tasmanian region during the middle Eocene.
F7. Paleogeographic map of the Tasmanian region at the Eocene/Oligocene boundary.
F8. Cross-sections from seismic profiles across the region showing DSDP and proposed high-priority ODP sites.
F9. Map of structures and minimum sediment thickness of the area west and south of Tasmania.
F10. Map of Cretaceous and Paleogene movements relative to a fixed Tasmania.
F11. The oceanographic fronts in the Southern Ocean south of Tasmania.
F12. Postdrilling interpretation for local seismic profile SO 36-47 across Site 1168.
F13. Postdrilling interpretation for local seismic profile AGSO 125-14 across Site 1170.
F14. Postdrilling interpretation for local seismic profile AGSO 202-5 across Site 1171.
F15. Postdrilling interpretation for local seismic profile AGSO 125-4 across Site 1172.
F16. Summary of lithologies, Sites 1168 through 1172.
F17. Comparison of major age stratigraphic units by depth, Sites 1168 through 1172.
F18. Summary stratigraphic and sediment facies, Sites 1168 through 1172.
F19. Sedimentation rate summary curves, Sites 1168 through 1172.
F20. Smoothed GRA bulk density and MST magnetic susceptibility data for Leg 189 sites.
F21. Downhole natural gamma and medium resistivity results, Holes 1168A, 1170D, 1171D, and 1172D.
F22. Summary of organic geochemistry results.
F23. Summary of interstitial water geochemistry results, Sites 1168, 1170, 1171, and 1172.
F24. Schematic diagram showing inferred middle Eocene surface-water circulation.
F25. Schematic diagram showing inferred surface earliest Oligocene water circulation.
F26. Schematic diagram showing inferred late Oligocene surface-water circulation.
T1. Deep Sea Drilling Project sites off Tasmania.
T2. Leg 189 operations summary.
T3. Summary of magnetostratigraphy.
T4. Tectonic history of DSDP and ODP sites in the region.