![]() Figures F1-F54
Figures F1-F54
![]() Tables
T1-T25
Tables
T1-T25
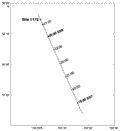
F1. Location of the JOIDES Resolution seismic profile.
F2. Single-channel seismic profile.
![]()
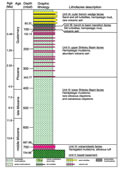
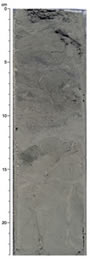
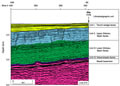
F3. Stratigraphic column.
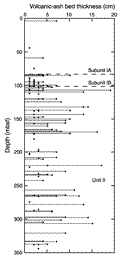
F4. Distribution and thickness of volcanic ash layers.
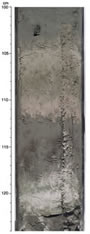
F5. Sandy turbidite of Subunit IA interbedded with silty clay.
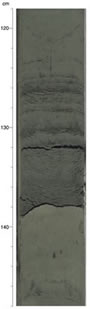
F6. Gray and green and pink and brown volcanic ash beds from Unit II interbedded with silty clays.
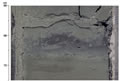
F7. Volcanic ash bed from Unit II interbedded with silty clays.
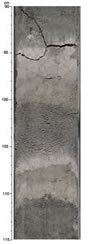
F8. Bioturbated silty claystone and interbedded siliceous claystone from Unit III.
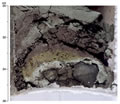
F9. Basalt (Unit V) and silty claystone (Unit IV).
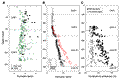
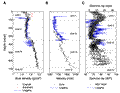
F10. Abundances of clay minerals, quartz, plagioclase, and calcite.
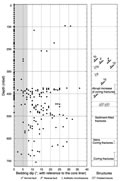
F11. Bedding dips relative to the core liner plotted against depth.
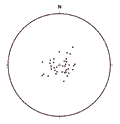
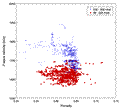
F12. Equal-area lower-hemisphere stereographic plot of poles to bedding.
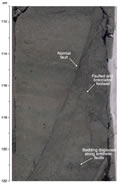
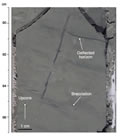
F13. Healed high-angle normal fault showing antithetic faults and brecciation in the footwall.
F14. Zone of foliated breccia.
F15. Sediment-filled structure probably caused by fluid escape.
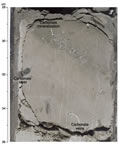
F16. Mineralized veins transecting a carbonate horizon.
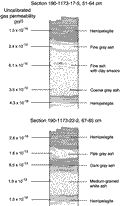
F17. Variation of uncalibrated gas permeability with depth.
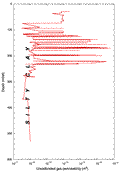
F18. Uncalibrated gas-permeability variations.
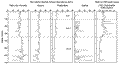
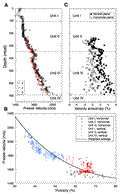
F19. Paleomagnetic inclination.
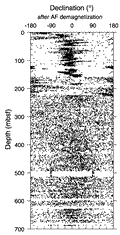
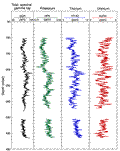
F20. Paleomagnetic declination.
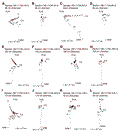
F21. Vector end-point diagrams for discrete samples and archive-half sections.
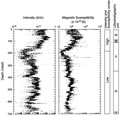
F22. Comparison of magnetic intensity and MST magnetic susceptibility.
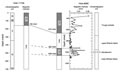
F23. Magnetic intensity correlation between Holes 1173A and 808C.
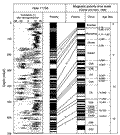
F24. Magnetostratigraphy.
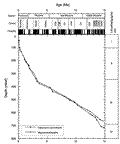
F25. Age-depth plot.
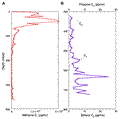
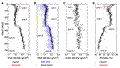
F26. Interstitial fluid compositions as a function of depth.
F27. Molecular compositions and concentrations of headspace gases.
F28. TOC and nitrogen contents in sediments.
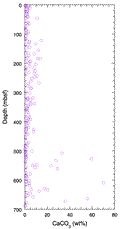
F29. Percentage of inorganic carbon (carbonate) in sediments.
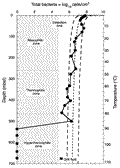
F30. Depth and temperature distribution of total bacterial populations in sediment samples.
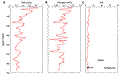
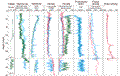
F31. TOC, ammonium, alkalinity, methane, and sulfate profiles vs. depth.
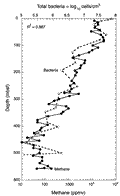
F32. Relationship between total bacterial populations and in situ methane concentrations.
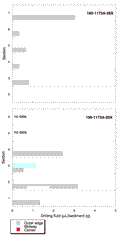
F33. Drilling fluid intrusion into APC cores.
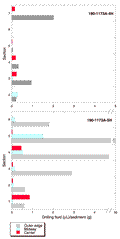
F34. Drilling fluid intrusion into XCB cores.
F35. Bulk density, grain density, and porosity.
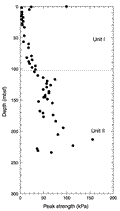
F36. Undrained peak shear strength.
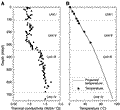
F37. Thermal conductivity and temperature trends.
F38. P-wave velocity and velocity anisotropy.
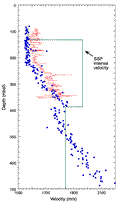
F39. Formation factor and anisotropy of electrical conductivity.
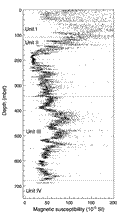
F40. Magnetic susceptibility.
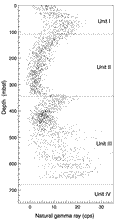
F41. Natural gamma ray.
F42. Bulk density, P-wave velocity, and gamma-ray data.
F43. Summary plot of logs.
F44. Spectral gamma ray, potassium, thorium, and uranium.
F45. Comparison of P-wave velocity measurements.
F46. P-wave velocity vs. porosity.
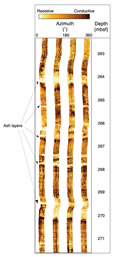
F47. FMS image of ash layers.
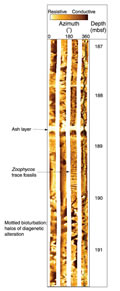
F48. FMS image of bioturbated interval with ash layer.
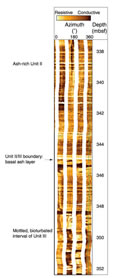
F49. FMS image of the Unit II/III boundary.
F50. Temperatures measured by APC temperture tool.

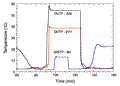
F51. Temperatures measured during the WSTP and DVPT stations.
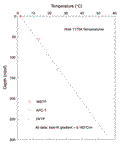
F52. Temperatures vs. depth.
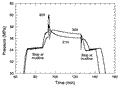
F53. Pressures measured during the DVTP-P stations.
F54. Three-dimensional seismic reflection line 215.
T1. Coring summary.
T2. Coring summary by section.
T3. Site 1173 stratigraphic units compared with correlative units at Site 808.
T4. Peak intensity and peak area XRD analyses.
T5. Mineral abundances and peak-area ratios from XRD analyses.
T6. X-ray diffraction analysis, Hole 1173A.
T7. Structural data.
T8. Recognized nannofossil events.
T9. Interval and depth constraints of calcareous nannofossil events.
T10. Epoch boundaries.
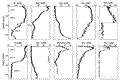
T11. Calcareous nannofossil range chart (Zones NN21-NN19).
T12. Calcareous nannofossil range chart (Zones NN18-NN9).
T13. Calcareous nannofossil range chart (Zones NN9-NN6).
T14. Depths and ages of magnetic chrons and subchrons.
T15. Pore fluid composition.
T16. Headspace and vacutainer gas analyses, Hole 1173A.
T17. Carbon, nitrogen, sulfur, and hydrogen analyses.
T18. Total bacterial populations in sediments.
T19. Comparison of near-surface sediment bacterial populations.
T20. Drilling fluid intrusion estimates based on PFT tracer experiments.
T21. Drilling fluid intrusion estimated based on fluorescent microsphere tracer experiments.
T22. Formation factor obtained by the needle-probe method.
T23. Electrical conductivity and formation factor obtained on sample cubes.
T24. Summary of logging runs.
T25. Downhole temperature measurements.