![]() Figures F1-F35
Figures F1-F35
![]() Tables
T1-T21
Tables
T1-T21
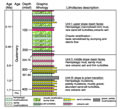
F1. Stratigraphic column.
F2. Distribution and thickness of volcanic ash layers.
F3. Volcanic ash from Unit I.
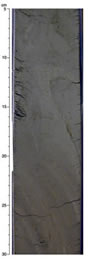
F4. Sandy turbidite of Unit I.
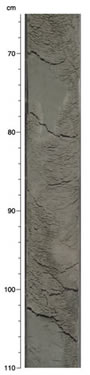
F5. Overturned ash bed from Unit I.
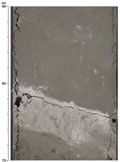
F6. Chaotic bedding of Unit I.
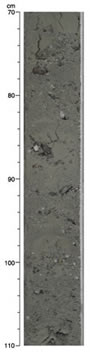
F7. Pebbly mudstone from Unit III.
F8. Abundances of total clay minerals, quartz, plagioclase, and calcite.
F9. Bedding dips relative to the core liner vs. depth.
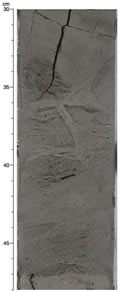
F10. Example of a slump-fold hinge.
F11. Stereographic projections of poles to bedding and fold axial planes.
F12. Stereographic projections of the orientation of minor normal faults.
F13. Poorly lithified coarse sand exhibiting apparent web structure.
F14. Uncalibrated gas-permeameter results.
F15. Paleomagnetic declination, inclination, and intensity.
F16. Magnetostratigraphy.
F17. Age-depth plot.
F18. Magnetic disturbance experiment.
F19. Overprint removal experiment.
F20. Pore fluid compositions as a function of depth.
F21. Molecular compositions and concentrations of headspace gases.
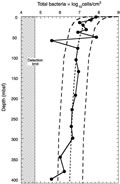
F22. Depth distribution of total bacterial populations in sediment samples.
F23. Depth profiles of total bacteria and methane concentrations.
F24. Bulk density, grain density, and porosity.
F25. Undrained peak shear strength.
F26. Thermal conductivity and temperature trends.
F27. P-wave velocity and impedance.
F28. Formation factor.
F29. Magnetic susceptibility.
F30. Natural gamma ray.
F31. Temperatures measured with the Adara APC temperature tool.
F32. Temperatures measured during the DVTP stations.
F33. Hole 1175A temperatures.
F34. Pressures measured during the DVTP-P stations.
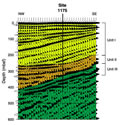
F35. Three-dimensional seismic reflection line 281.
T1. Coring summary.
T2. Coring summary by section.
T3. Summary of stratigraphic relations.
T4. Peak intensities and peak areas from XRD analysis of sediments.
T5. Mineral abundances based on XRD analysis of bulk-sediment powders.
T6. XRD analysis of bulk-powder volcanic ash, Hole 1175A.
T7. Structural data.
T8. Recognized nannofossil events.
T9. Interval and depth constraints of calcareous nannofossil events.
T10. Calcareous nannofossil range chart.
T11. Depths and ages of magnetic chrons.
T12. Pore fluid compositions, Hole 1175A.
T13. Headspace and vacutainer gas analyses, Hole 1173A.
T14. Carbon, nitrogen, sulfur, and hydrogen analyses, Hole 1173A.
T15. Total bacterial populations in sediments.
T16. Comparison of near-surface sediment bacterial populations at Site 1175 with data from nine other ODP sites.
T17. Drilling fluid intrusion estimates based on PFT experiments.
T18. Fluorescent microsphere tracer experiments.
T19. Formation factor obtained by the needle-probe method.
T20. Electrical conductivity and formation factor for sample cubes.
T21. Summary of temperature measurements.