![]() Figures F1-F50
Figures F1-F50
![]() Figures
F51-F74
Figures
F51-F74
![]() Tables
T1-T16
Tables
T1-T16
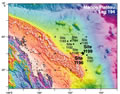
F1. Bathymetry map.
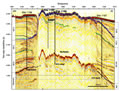
F2. Seismic line MAR13.
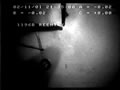
F3. Bare-rock reentry of Hole 1196B with an ADCB bit without the aid of a free-fall funnel.
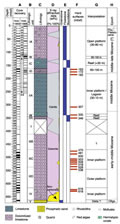
F4. Lithologic summary, Site 1196.
F5. Close-up photograph of uppermost part of Core 194-1196A-1R.
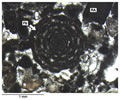
F6. Photomicrograph of corrugated upper surface of the platform carbonates.
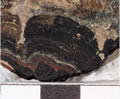
F7. Close-up photograph of stromatolitic crust.
F8. Photomicrograph of stromatolitic crust.
F9. Close-up photograph of macrofacies of dolomitic floatstone/rudstone.
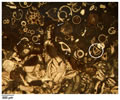
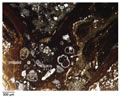
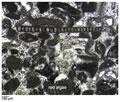
F10. Photomicrograph showing microfacies of grainstone matrix.
F11. Close-up photograph of macrofacies of dolomitic floatstone.
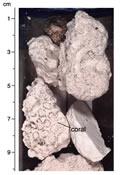
F12. Close-up photograph of coral boundstone/rudstone.
F13. Close-up photograph of dolomitic floatstone.
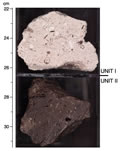
F14. Close-up photograph of Unit I/II boundary.
F15. Close-up photograph of skeletal floatstone.
F16. Photomicrograph of skeletal floatstone.
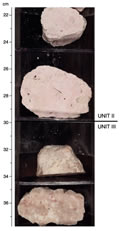
F17. Close-up photograph of Unit II/III boundary.
F18. Close-up photograph of macrofacies of the sucrosic dolostone.
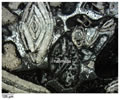
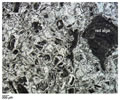
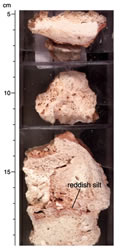
F19. Photomicrograph showing microfacies of variegated dolostone.
F20. Close-up photograph of possible exposure surface in variegated dolostone.
F21. Close-up photograph of macrofacies from Subunit IIID.
F22. Close-up photograph of facies variability in Unit IV.
F23. Close-up photograph of macrofacies of Oligocene rocks.
F24. Lithologic summary, Site 1199.
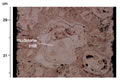
F25. Close-up photograph of geopetal structure.
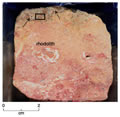
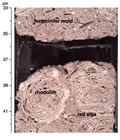
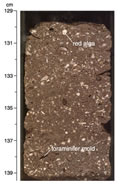
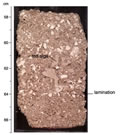
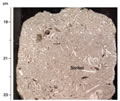
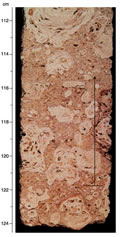
F26. Close-up photograph of interval of coarse-tail grading of rhodoliths.
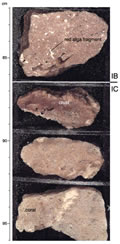
F27. Close-up photograph of Subunit IB/IC boundary.
F28. Close-up photograph of vuggy porosity and infiltrated reddish silt within dolomitic skeletal rudstone.
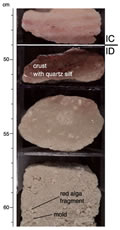
F29. Close-up photograph of Subunit IC/ID boundary.
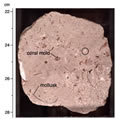
F30. Close-up photograph of Subunit IIA lithology.
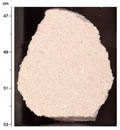
F31. Close-up photograph of Subunit IIB lithology.
F32. Photomicrograph of transverse section of Flosculinella botangensis specimen.
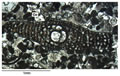
F33. Photomicrograph of vertical section of a Soritidae specimen.
F34. Zijderveld plot for long-core interval.
F35. Long-core measurements of intensity and inclinations.
F36. Long-core measurements for Holes 1196A and 1196B.
F37. Zijderveld plot for Sample 194-1196A-65R-3, 94-96 cm.
F38. Variation of intensity of NRM, ARM, and IRM.
F39. Variation of rock magnetism parameters.
F40. Long-core measurements.
F41. Example of an orthogonal vector component diagram.
F42. Age-depth model and sedimentation rates.
F43. Carbonate mineralogy.
F44. Carbon, HI, and sulfur results.
F45. Carbonate and noncarbonate fraction.
F46. Carbonate content.
F47. Bulk density, grain density, and porosity.
F48. Grain density and dolomite content.
F49. P-wave velocity and anisotropy of P-wave velocity, Site 1196.
F50. Crossplot of velocity vs. porosity, Site 1196.