![]() Figures F1-F50
Figures F1-F50
![]() Figures
F51-F74
Figures
F51-F74
![]() Tables T1-T16
Tables T1-T16
F51. Thermal conductivity, Site 1196.
F52. Crossplot of thermal conductivity vs. porosity, Site 1196.
F53. Magnetic susceptibility and natural gamma radiation, Site 1196.
F54. Comparison of NGR and MS measurements.
F55. GRA and MAD bulk density, grain density, and porosity.
F56. P-wave velocity and anisotropy of P-wave velocity, Site 1199.
F57. Crossplot of velocity vs. porosity, Site 1199.
F58. Thermal conductivity, Site 1199.
F59. Crossplot of thermal conductivity vs. porosity, Site 1199.
F60. Magnetic susceptibility and natural gamma radiation, Site 1199.
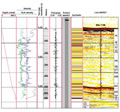
F61. Summary of geophysical logs, Site 1196.
F62. Time-depth curves.
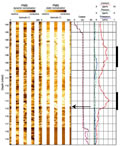
F63. Interpretation of geophysical logging data.
F64. FMS images, 121-130.2 and 160-166.2 mbsf.
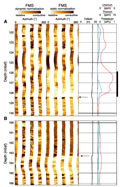
F65. FMS image, 303.5-311 mbsf.
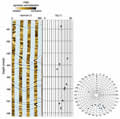
F66. FMS image of a fractured interval.
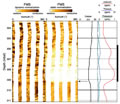
F67. Composite logs, Hole 1199A.
F68. Interpretation of geophysical logging data, Hole 1199A.
F69. FMS image, 103.5-120 mbsf, Site 1199.
F70. Cross-correlation of log responses.
F71. Alternative correlation of log responses.
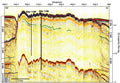
F72. Multichannel line MAR07, Site 1196.
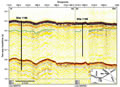
F73. Multichannel line MAR70 connected with seismic line MAR20.
F74. Synthetic seismogram plotted on line MAR07.
T1. Coring summaries.
T2. Expanded coring summaries.
T3. Lithologic units recovered at Site 1196.
T4. Site 1199 lithologic units and tentative correlation with units defined at Site 1196.
T5. Summary of biostratigraphic and paleoenvironmental interpretations, Site 1196.
T6. Summary of biostratigraphic and paleoenvironmental interpretations, Site 1199.
T7. Age-depth control points.
T8. Age picks.
T9. Calcite, dolomite, and noncarbonate minerals.
T10. Carbon, nitrogen, sulfur, and hydrogen concentrations.
T11. Rock-Eval pyrolysis results.
T12. Inorganic carbon.
T13. X-ray diffraction mineralogy.
T14. Logging operations, Hole 1196A.
T15. Time-depth correlation.
T16. Logging operations, Hole 1199A.