![]() Figures
F1-F34
Figures
F1-F34
![]() Tables T1-T13
Tables T1-T13
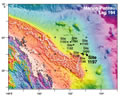
F1. Bathymetry map.
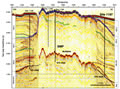
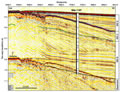
F2. Seismic line MAR07.
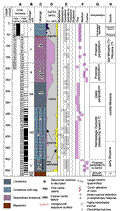
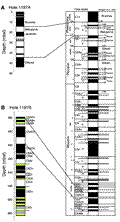
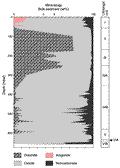
F3. Lithologic summary.
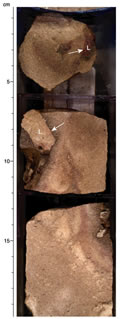
F4. Close-up photograph of indurated skeletal grainstone capped by a phosphatic crust.
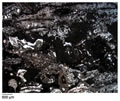
F5. Photomicrograph showing late-stage infilling of a boring.
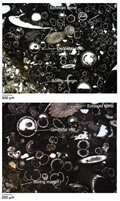
F6. Photomicrograph showing skeletal packstone dominated by planktonic foraminifers.
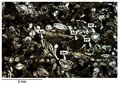
F7. Photomicrograph showing skeletal grainstone containing abundant larger benthic foraminifers.
F8. Close-up photograph of skeletal grainstone containing abundant Lepidocyclina sp.
F9. Photomicrograph of a fine sand-sized skeletal grainstone.
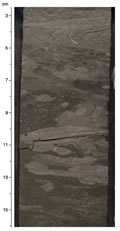
F10. Photograph showing alternating dark- and light-colored intervals of fine-grained skeletal packstone and grainstone.
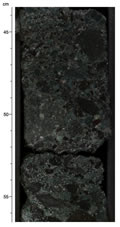
F11. Close-up photograph of extensive bioturbation at the contact between an interval of grainstone overlying a skeletal packstone.
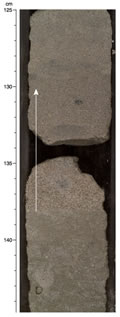
F12. Close-up photograph of small turbidite bed with a sharp planar base.
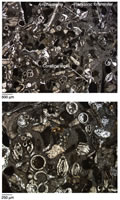
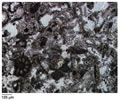
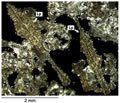
F13. Photomicrograph showing skeletal packstone containing abundant larger benthic foraminifers.
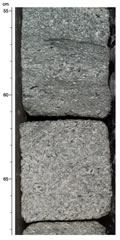
F14. Close-up photograph of fining-upward package of coarse skeletal grainstone.
F15. Close-up photograph of skeletal floatstone containing bryozoan fragments.
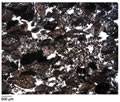
F16. Close-up photograph of matrix-supported volcaniclastic breccia.
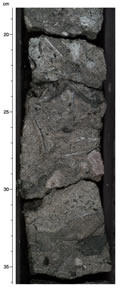
F17. Photograph showing neritic sediments.
F18. Photograph illustrating vertical sections through Lepidocyclina.
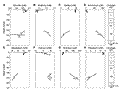
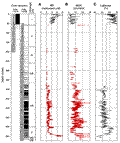
F19. Long-core measurements, Hole 1197A.
F20. Long-core measurements, Hole 1197B.
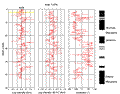
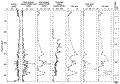
F21. Comparison of observed magnetic stratigraphies.
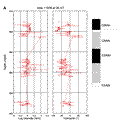
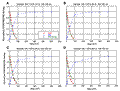
F22. Normalized ARM, IRM acquisition, and IRM demagnetization curves vs. demagnetizing steps.
F23. NRM, ARM, and IRM plotted down the core.
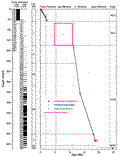
F24. Age-depth model and sedimentation rates.
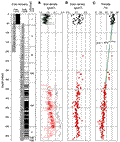
F25. Dissolved constituents.
F26. Carbonate minerals determined by X-ray diffraction.
F27. Carbon, HI, and sulfur results.
F28. Bulk density, grain density, and porosity.
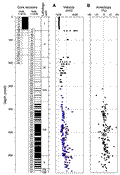
F29. P-wave and velocity.
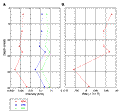
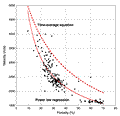
F30. Crossplot of velocity vs. porosity.
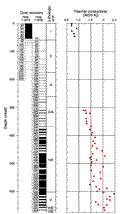
F31. Average thermal conductivity.
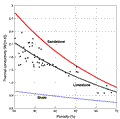
F32. Crossplot of porosity and thermal conductivity.
F33. Comparison of magnetic susceptibility, natural gamma radiation, and color reflectance.
F34. Multichannel line MAR07.
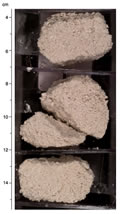
T1. Coring summary.
T2. Expanded coring summary.
T3. Lithologic units and subunits.
T4. Biostratigraphic datums.
T5. Summary of paleoenvironmental interpretations.
T6. Magnetic polarity transitions.
T7. Age-depth control points.
T8. Age picks.
T9. Headspace gas composition.
T10. Interstitial water chemistry.
T11. Aragonite, calcite, dolomite, and noncarbonate mineral percentages.
T12. Carbon, nitrogen, sulfur, and hydrogen results.
T13. Rock-Eval pyrolysis results.