![]() Figures
F1-F50
Figures
F1-F50
![]() Figures
F51-F93
Figures
F51-F93
![]() Tables
T1-T18
Tables
T1-T18
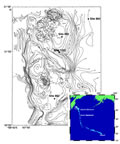
F1. Site 1203 location map.
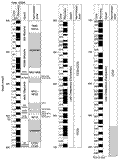
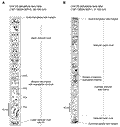
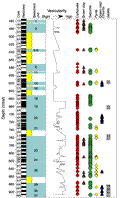
F2. Lithology, units, time framework, and principal components.
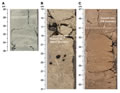
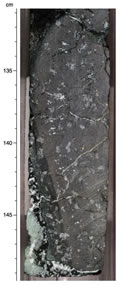
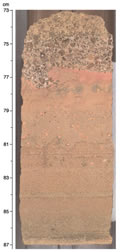
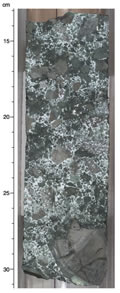
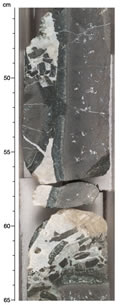
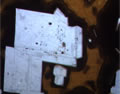
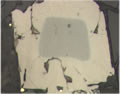
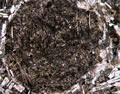
F3. Core photos of lithologies observed.
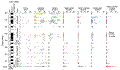
F4. Calcareous nannofossil zones in Hole 1203A.
F5. Basement rocks and biostratigraphic ages.
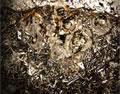
F6. Basement rock lithologic features.
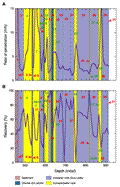
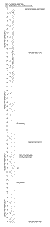
F7. Basement units, drilling rate, and recovery.
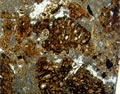
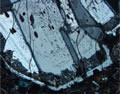
F8. Large plagioclase phenocrysts.
F9. Boundary between Units 8 and 9.
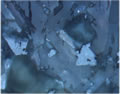
F10. Vesicular reticulite-like basalt tephra clasts.
F11. Basalt tephra clasts with fluidal outlines and elongate vesicles.
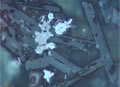
F12. Scoria fall deposit features.
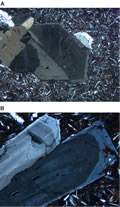
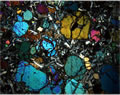
F13. Vesicular cuspate basalt tephra clasts.
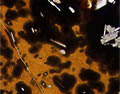
F14. Volcanic breccia in a carbonate-rich matrix.
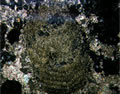
F15. Coralline algae.
F16. Glassy margins and fragments in calcite matrix.
F17. Altered glassy lobe margins.
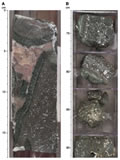
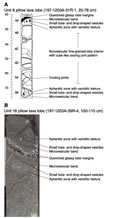
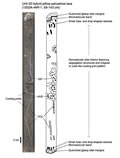
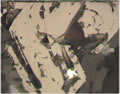
F18. Pillow lava unit graphic log and photograph.
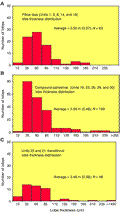
F19. Lobe thickness distribution of lavas.
F20. Microlites in a glassy lobe margin.
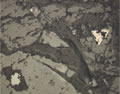
F21. Lobe structures in compound pahoehoe lava.
F22. Hybrid pillow-pahoehoe lava structures.
F23. Structure of pahoehoe sheet lobes.
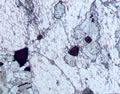
F24. Zonation in plagioclase.
F25. Melt inclusions in plagioclase.
F26. Resorption of plagioclase phenocryst with melt inclusions.
F27. Olivine glomerocryst with calcite vein at top.
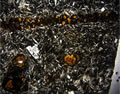
F28. Skeletal olivine pseudomorph.
F29. Olivine-rich zone.
F30. Cr spinel inclusions in olivine.
F31. Parallel acicular clinopyroxene crystals.
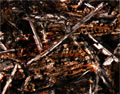
F32. Example of subophitic texture.
F33. Segregated material in vesicle cylinder (Unit 23).
F34. Segregated material in vesicle cylinder (Unit 26).
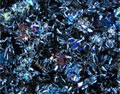
F35. Ilmenite exsolution in titanomagnetite.
F36. Titanomagnetite with maghemite alteration.
F37. Titanomagnetite with extensive maghemite alteration.
F38. Titanomagnetite with maghemite rim.
F39. Unaltered titanomagnetite and pentlandite.
F40. Cr spinel in olivine and a titanomagnetite crystal.
F41. Cr spinel with titanomagnetite overgrowth.
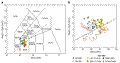
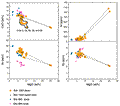
F42. Total alkali vs. SiO2 plots.
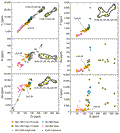
F43. Ti, P, Na, K, Sr, and Ba vs. Zr.
F44. Segregated material in vesicle cylinder.
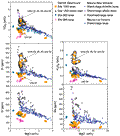
F45. Ni, Sc, Sr, and CaO vs. MgO.
F46. TiO2, P2O5, Zr, Sr, and Ba vs. MgO.
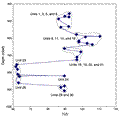
F47. Ti/Zr abundance ratio vs. depth.
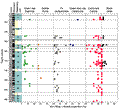
F48. Principal alteration minerals.
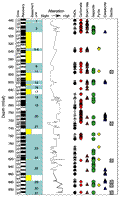
F49. Vesicle filling with depth.
F50. Vein filling with depth.
![]() Figures
F1-F50
Figures
F1-F50
![]() Figures
F51-F93
Figures
F51-F93
![]() Tables
T1-T18
Tables
T1-T18