![]() Figures F1-F43
Figures F1-F43
![]() Tables
T1-T11
Tables
T1-T11
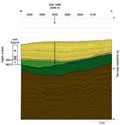
F1. Interpretation of seismic reflection profile, Site 1208.
F2. Coring results, Hole 1208A.
F3. Change in circulation in North Pacific associated with closure of Indonesian Seaway.
F4. Interpretation of evolution of the stratigraphic section, Site 1208.
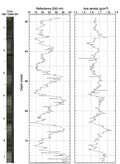
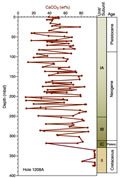
F5. Core recovery, lithology, lithologic units, age with corresponding biostratigraphic zonations, color reflectance, and percent carbonate, Hole 1208A.
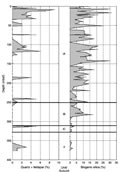
F6. Downhole plots of smear slide estimates.
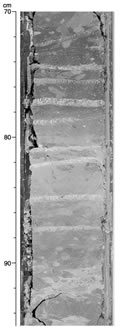
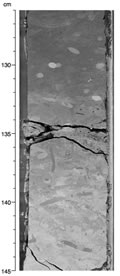
F7. Subparallel discontinuities that could be the product of repeated erosion, faulting, or slumping.
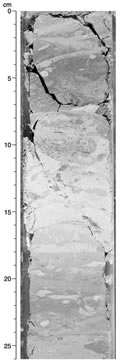
F8. Subhorizontal, diffuse color bands just below a burrowed contact between two types of nannofossil ooze.
F9. Composite digital photograph, color reflectance, and bulk density, Core 198-1208A-8H.
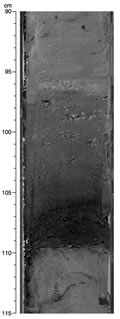
F10. Dark, greenish black (5G 2/1) ash overlying abrupt contact.
F11. Near-vertical burrow structure partly filled by dark pyrite that crosscuts core diagonally.
F12. Zoophycos, Chondrites, and Planolites burrows.
F13. Distinct Planolites burrows and example of "abundant" level of bioturbation where 100% of surface is burrowed.
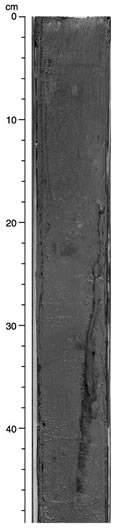
F14. Composite burrow and less distinct Zoophycos and Planolites burrows, 0-26 cm.
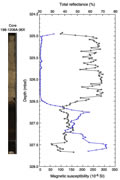
F15. Composite digital photograph, color reflectance, and magnetic susceptibility, Core 198-1208A-36X.
F16. Color reflectance plotted with obliquity, and precession, Hole 1208A.
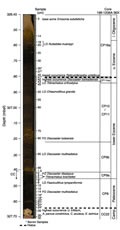
F17. Positions of nannofossil toothpick samples and age-diagnostic nannofossil datums.
F18. Archive-half magnetization intensities prior to and after AF demagnetization at peak fields of 20 mT, Hole 1208A.
F19. Inclination after AF demagnetization at peak fields of 20 mT, Hole 1208A.
F20. Age-depth curve derived from magnetic stratigraphy.
F21. Age-depth plot of calcareous nannofossil and planktonic foraminiferal datums, Hole 1208A.
F22. Age-depth plot of middle Eocene-late Paleocene calcareous nannofossil and planktonic foraminiferal datums, Hole 1208A.
F23. Age-depth plot of Neogene calcareous nannofossil and planktonic foraminiferal datums, Hole 1208A.
F24. Age-depth plot of early Miocene-late Eocene calcareous nannofossil and planktonic foraminiferal datums, Hole 1208A.
F25. Age-depth plot of Cretaceous calcareous nannofossil and planktonic foraminiferal datums, Hole 1208A.
F26. Mass accumulation rates vs. depth and age for the Neogene, Hole 1208A.
F27. Decreasing sulfate vs. CH4 concentrations.
F28. CH4 vs. sulfate concentrations at Sites 1208, 846, 849, and 1009.
F29. Carbonate profile.
F30. Alkalinity, sulfate, ammonium, and phosphate profiles.
F31. Crossplots implying related processes in Hole 1208A.
F32. Lithium, silicate, manganese, and iron profiles.
F33. Cation profiles.
F34. Whole-core magnetic susceptibility vs. depth.
F35. Whole-core GRA bulk density vs. depth.
F36. Whole-core P-wave velocity vs. depth.
F37. MST natural gamma radiation data vs. depth.
F38. Discrete P-wave velocities vs. depth.
F39. Discrete P-wave velocities vs. discrete wet bulk density.
F40. Whole-core thermal conductivity vs. depth.
F41. Whole-core thermal conductivity vs. discrete porosity measurements.
F42. Discrete wet, dry, and grain density vs. depth.
F43. Calculated water content, porosity, and void ratio vs. depth.
T1. Coring summary.
T2. Summary of color and sedimentary features, Subunit IA.
T3. Calcareous nannofossil datums, ages, and depths.
T4. Planktonic foraminifer datums, ages, and depths.
T5. Cenozoic and Cretaceous benthic foraminifers.
T6. Headspace CH4 concentrations.
T7. Carbonate content.
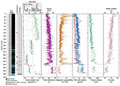
T8. Geochemical analyses, Hole 1208A.
T9. Discrete index properties measurements.
T10. Discrete measurements of P-wave velocity.
T11. Discrete measurements of thermal conductivity.