![]() Figures F1-F35
Figures F1-F35
![]() Tables
T1-T15
Tables
T1-T15
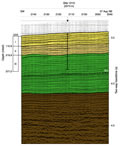
F1. Interpretation of seismic reflection profile.
F2. Coring results, Site 1210.
F3. Comparison of magnetic susceptibility records, Holes 1210A and 1210B.
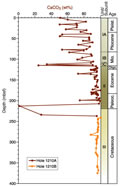
F4. Core recovery, lithology, lithologic units, age with corresponding biostratigraphic zonations, color reflectance, and percent carbonate.
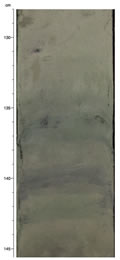
F5. Green lamina crosscutting some burrows.
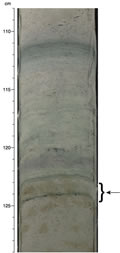
F6. Burrow crosscutting green lamina.
F7. Example of well-defined pale green lamina with diffuse purple banding above and below.
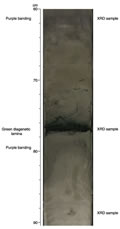
F8. X-ray diffactograms for bulk sediment and green lamina.
F9. Composite digital photograph, color reflectance, and bulk density, Core 198-1210A-13H.
F10. Composite digital photograph, color reflectance, and bulk density, Core 198-1210A-20H.
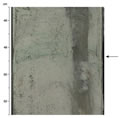
F11. Diffuse green and purple banding.
F12. Archive-half magnetization intensities after AF demagnetization at peak fields of 20 mT.
F13. Inclination after AF demagnetization at peak fields of 20 mT, Holes 1210A and 1210B.
F14. Age-depth curve derived from magnetic stratigraphy.
F15. Magnetic susceptibility data and GRA bulk density data.
F16. Magnetic susceptibility data, 115 to 135 mcd.
F17. Age-depth plot of calcareous nannofossil and planktonic foraminiferal datums.
F18. Age-depth plot of Neogene calcareous nannofossil and planktonic foraminiferal datums.
F19. Age-depth plot of early Miocene-late Eocene calcareous nannofossil and planktonic foraminiferal datums.
F20. Age-depth plot of early Oligocene-late Paleocene calcareous nannofossil and planktonic foraminiferal datums.
F21. Age-depth plot of early Eocene-Campanian calcareous nannofossil and planktonic foraminiferal datums.
F22. Mass accumulation rates vs. age and depth for the Campanian-Pleistocene.
F23. Carbonate profiles.
F24. Chloride ion concentrations.
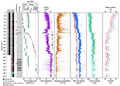
F25. Alkalinity, sulfate, ammonium, phosphate, iron, and manganese profiles.
![]()
F26. Potassium, calcium, magnesium, strontium, and lithium profiles.
F27. Silica profile.
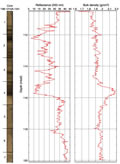
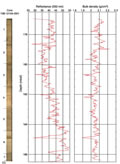
F28. Whole-core MST magnetic susceptibility.
F29. Whole-core MST GRA and discrete bulk density vs. depth.
F30. Whole-core MST and discrete P-wave velocity vs. depth.
F31. MST natural gamma radiation vs. depth.
F32. Discrete P-wave velocities.
F33. P-wave velocities vs. wet bulk density.
F34. Wet bulk, dry, and grain density vs. depth.
F35. Water content, porosity, and void ratio vs. depth.
T1. Coring summary.
T2. Mineralogy of clay fraction.
T3. Calcareous nannofossil datums, ages, and depths.
T4. Planktonic foraminifer datums, ages, and depths.
T5. Cenozoic and Cretaceous benthic foraminifers, Hole 1210A.
T6. Cenozoic and Cretaceous benthic foraminifers, Hole 1210B.
T7. Composite depth section.
T8. Splice tie points.
T9. Linear sedimentation rate segments and average accumulation rates.
T10. Headspace CH4 concentrations.
T11. Carbonate content.
T12. Results from CNSH analysis.
T13. Results of geochemical analyses.
T14. Discrete measurements of P-wave velocity.
T15. Discrete index properties measurements.