![]() Figures F1-F33
Figures F1-F33
![]() Tables
T1-T13
Tables
T1-T13
F1. Coring results.

F2. Age-depth curves based on shipboard biostratigraphy, Sites 1209-1212.
F3. Summary of lithostratigraphy, Sites 1207-1214.
F4. Core recovery, lithology, lithologic units, age with corresponding biostratigraphic zonations, color reflectance, and percent carbonate, Hole 1212B.
F5. Estimates of biosiliceous material, Hole 1212A.

F6. Color reflectance ratio, Holes 1212A and 1212B.
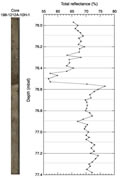
F7. Color reflectance, Cores 198-1212B-3H and 5H.
F8. Clay-rich layer at the P/E boundary, Section 198-1212A-10H-1.
F9. Archive-half magnetization intensities after AF demagnetization at peak fields of 20 mT.

F10. Inclination after AF demagnetization at peak fields of 20 mT.
F11. Age-depth curve derived from magnetic stratigraphy.

F12. Magnetic susceptibility and GRA density.
F13. Magnetic susceptibility data for 0 to 50 mcd.

F14. Age-depth plot of calcareous nannofossil and planktonic foraminiferal datums.
F15. Age-depth plot of Neogene calcareous nannofossil and planktonic foraminiferal datums.
F16. Age-depth plot of early Oligocene-late Paleocene calcareous nannofossil and planktonic foraminiferal datums.

F17. Age-depth plot of early Eocene-Campanian calcareous nannofossil and planktonic foraminiferal datums.
F18. Age-depth plot of Maastrichtian-Albian calcareous nannofossil and planktonic foraminiferal datums.
F19. Mass accumulation rates vs. depth and age for the Maastrichtian-Pleistocene.
F20. Carbonate profile.

F21. Sodium and chloride profiles.

F22. Sulfate, alkalinity, ammonium, and phosphate profiles.
F23. Manganese and iron profiles.

F24. Potassium, calcium, magnesium, strontium, and lithium profiles.
F25. Silica profile.
F26. Whole-core MST magnetic susceptibility.
F27. Whole-core MST GRA and discrete bulk density vs. depth.
F28. Whole-core MST and discrete P-wave velocity vs. depth.
F29. Discrete P-wave velocities.

F30. MST natural gamma radiation vs. depth.
F31. P-wave velocity vs. wet bulk density.
F32. Water content, porosity, and void ratio vs. depth.

F33. Wet bulk, dry, and grain density vs. depth, Holes 1212A and 1212B.
T1. Coring summary.
T2. Calcareous nannofossil datums, ages, and depths.
T3. Planktonic foraminifer datums, ages, and depths.
T4. Cenozoic and Cretaceous benthic foraminifers, Hole 1212A.
T5. Cenozoic and Cretaceous benthic foraminifers, Hole 1212B.
T6. Composite depth section.
T7. Splice tie points.
T8. Linear sedimentation rate segments and average accumulation rates.
T9. Headspace CH4 concentrations.
T10. Carbonate content.
T11. Geochemical data.
T12. Discrete index properties measurements.
T13. Discrete measurements of P-wave velocity.