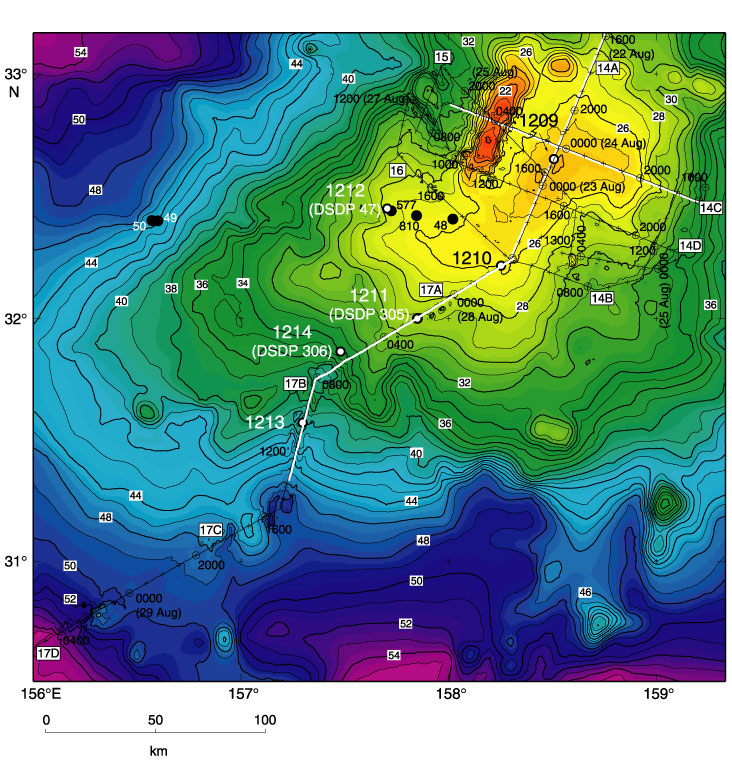
Figure F2. The South High (TAMU massif of Sager et al., 1999) survey area showing the locations of seismic reflection profiles collected for this study and ODP Leg 198 drill sites (1209-1214). Numbers in boxes indicate seismic line numbers. Bold white lines show seismic profiles that are shown in Figure F8. The remaining seismic profiles are shown in Figures F13 and F14. Bathymetric data are from Sager et al. (1999), and depth units are meters x 102. The location of the South High survey area is shown in Figure F1.