![]() Figures F1-F27
Figures F1-F27
![]() Tables
T1-T10
Tables
T1-T10
F1. Lithostratigraphic summary.
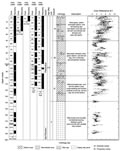
F2. Lithostratigraphy vs. NGR.
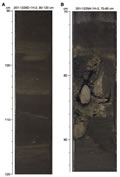
F3. Site 1229 features.
F4. Diffractogram of dolomite.
F5. Dissolved species in IW.
F6. Subsampling for MBIO, Hole 1229A.
F7. Subsampling for MBIO, Hole 1229D.
![]()
F8. Prokaryotic cells enumerated by AODC.
F9. Total prokaryote profile.
F10. Comparison of magnetic susceptibility.
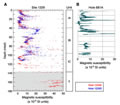
F11. Magnetic intensity.
F12. Principal component analysis, 201-1229A-4H-6, 70-72 cm.
F13. Principal component analysis, 201-1229A-3H-3, 65-67 cm.
F14. Principal component analysis, 201-1229A-14H-3, 110-112 cm.
F15. GRA bulk and MAD density data.
F16. Wireline resistivity.
F17. MAD measurements.
F18. P-wave velocity profiles.
F19. MST NGR and wireline profiles.
F20. Thermal conductivity measurements.
F21. Formation factor profile.
F22. DVTP temperature record.
F23. Temperatures vs. depth.
F24. DVTP-P pressure.
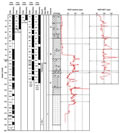
F25. Main logs recorded in Hole 1229A.
F26. Comparison between two passes of the tool string.
F27. Hole 1229A temperature log.
T1. Coring summary, Site 1229.
T2. Dissolved species in IW.
T3. Methane in headspace.
T4. Hydrogen concentrations.
T5. Seawater contamination based on PFT.
T6. Potential contamination of slurries based on PFT.
T7. Potential contamination of slurries based on beads.
T8. Media inoculated with material from Site 1229.
T9. Downhole temperatures.
T10. Logging operations, Hole 1229A.