![]() Figures F1-F20
Figures F1-F20
![]() Figures F21- F30
Figures F21- F30
![]() Tables
T1-T20
Tables
T1-T20
F21. Possible magnetic field excursion.
F22. Demagnetized and normalized NRM intensity.
![]()
F23. MS vs. demagnetized NRM intensity.
F24. Headspace and vacutainer methane and C1/C2 vs. depth.
F25. Interstitial water geochemical data.
F26. Calcium carbonate, TOC, and TN vs. depth.
F27. TOC/TN vs. TOC.
F28. Correlation of MS between Site 1233 core GeoB 3313-1.
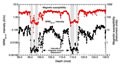
F29. Geomagnetic paleointensity from Sites 1233 and 1089 and Sint-200.
F30. Age model.
T1. Operations summary.
T2. Primary composite depth scale.
T3. Primary splice tie points.
T4. Secondary composite depth scale.
T5. Secondary splice tie points.
T6. OSUS-MS measurements, Hole 1233A.
T7. OSUS-MS measurements, Hole 1233B.
T8. OSUS-MS measurements, Hole 1233C.
T9. OSUS-MS measurements, Hole 1233D.
T10. OSUS-MS measurements, Hole 1233E.
T11. Lithologic Unit I.
T12. Ash layers.
T13. Distribution of calcareous nannofossils.
T14. Distribution of foraminifers.
T15. Distribution of diatoms.
T16. Headspace and vacutainer gas concentrations and C1/C2 ratio.
T17. Interstitial water geochemical data.
T18. IC, CaCO3, TC, TOC, and TN concentrations and TOC/TN ratio.
T19. Age control points.
T20. Age-depth model, LSRs, and MARs.
![]() Figures F1-F20
Figures F1-F20
![]() Figures F21-F30
Figures F21-F30
![]() Tables
T1-T20
Tables
T1-T20