![]() Figures F1-F20
Figures F1-F20
![]() Figures F21-F39
Figures F21-F39
![]() Tables
T1-T21
Tables
T1-T21
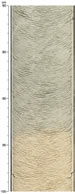
F21. Sharp color change at ~162 mcd.
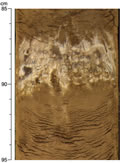
F22. Firmground in Subunit IIB.
F23. Simplified depositional history.
F24. Measured and predicted carbonate and TOC.
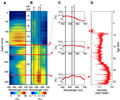
F25. Derivatives of reflectance spectra.
F26. Calcareous nannofossils and planktonic and benthic foraminifers.
F27. NRM intensity before and after AF demagnetization.
F28. NRM inclination after demagnetization.
F29. NRM Inclination after demagnetization, upper 100 mcd.
F30. Inclination after demagnetization, 100-200 mcd.
F31. Inclination after demagnetization, 200-300 mcd.
F32. Inclination after demagnetization, 300-360 mcd.
F33. Headspace methane vs. depth.
F34. Interstitial water geochemical data.
F35. Calcium carbonate, TOC, and TOC/TN vs. depth.
F36. TOC vs. CaCO3.
F37. S2 vs. TOC and HI vs. TOC.
F38. Biostratigraphic and magnetostratigraphic datums and age-depth model.

F39. Noncarbonate MARs and the three major components.
![]()
T1. Operations summary, Site 1237.
T2. Composite depth scale.
T3. Splice tie points.
T4. OSUS-MS measurements, Hole 1237A.
T5. OSUS-MS measurements, Hole 1237B.
T6. OSUS-MS measurements, Hole 1237C.
T7. OSUS-MS measurements, Hole 1237D.
T8. Definition and description of lithologic units and subunits.
T9. Ash layers.
T10. Age-depth control points.
T11. Distribution of calcareous nannofossils.
T12. Distribution of planktonic foraminifers.
T13. Distribution of benthic foraminifers.
T14. Distribution of diatoms.
T15. Determination of polarity chron boundaries.
T16. Paleomagnetic age control points.
T17. Headspace methane concentrations.
T18. Interstitial water geochemical data.
T19. IC, CaCO3, TC, TOC, and TN concentrations, and TOC/TN ratios.
T20. Results of Rock-Eval pyrolysis.
T21. Age-depth model, LSRs, and MARs.
![]() Figures F1-F20
Figures F1-F20
![]() Figures
F21-F39
Figures
F21-F39
![]() Tables
T1-T21
Tables
T1-T21