![]() Figures F1-F20
Figures F1-F20
![]() Figures
F21-F40
Figures
F21-F40
![]() Figures
F41-F43
Figures
F41-F43
![]() Tables
T1-T16
Tables
T1-T16
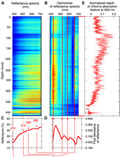
F21. Sequential depth plots and derivatives, Site 1238.
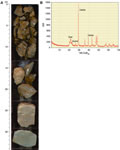
F22. Photo and XRD plot of chalk.
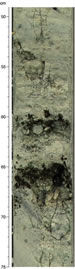
F23. Chalk interbedded with chert horizons.
F24. Time series analysis results based on biostratigraphic age model.
F25. Calcareous nannofossils, benthic foraminifers, and diatoms.
F26. NRM intensity before and after AF demagnetization.
F27. Inclinations and declinations after AF demagnetization.
F28. Inclination after AF demagnetization and NRM intensity.
F29. NRM before and after AF demagnetization for the upper 10 mcd of Hole 1238A.
F30. Headspace methane and C1/C2 ratios vs. depth.
F31. Interstitial water geochemical data.
F32. CaCO3, TOC, and TN concentrations, and TOC/TN ratios in sediments.
F33. CaCO3 vs. TOC and TN vs. TOC.
F34. Logging tool string deployments.
F35. Caliper, deviation, and gamma ray records.
F36. Density, porosity, sonic velocity, and resistivity data.
F37. Total and spectral gamma ray data.
F38. Downhole and core gamma ray vs. eld.
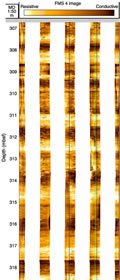
F39. FMS image illustrating meter-scale banding.
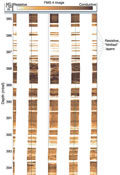
F40. FMS image showing the resistive, well-lithified beds.
![]() Figures F1-F20
Figures F1-F20
![]() Figures
F21-F40
Figures
F21-F40
![]() Figures
F41-F43
Figures
F41-F43
![]() Tables
T1-T16
Tables
T1-T16