![]() Figures F1-F20
Figures F1-F20
![]() Figures
F21-F32
Figures
F21-F32
![]() Tables
T1-T20
Tables
T1-T20
F21. Downhole distribution of ash layers, Sites 1240, 1239, and 1238.
F22. Calcareous nannofossils, planktonic and benthic foraminifers, and diatoms, Hole 1240A.
F23. NRM intensity before and after AF demagnetization.
F24. NRM inclinations after demagnetization.
F25. NRM declinations after demagnetization.
F26. Tensor-corrected declinations after demagnetization.
F27. Headspace methane concentrations.
F28. Interstitial water geochemical data.
F29. CaCO3, TOC, TOC CFB, TN, and TOC/TN.
F30. CaCO3 vs. TOC and TN vs. TOC.
F31. S2 vs. TOC and HI vs. TOC.
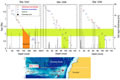
F32. Shipboard biostratigraphic and magnetostratigraphic datums and age-depth model.
T1. Operations summary, Site 1240.
T2. Composite depth scale.
T3. Splice tie points.
T4. OSUS-MS measurements, Hole 1240A.
T5. OSUS-MS measurements, Hole 1240B.
T6. OSUS-MS measurements, Hole 1240C.
T7. OSUS-MS measurements, Hole 1240D.
T8. Lithologic Unit I, Site 1240.
T9. Ash layers, Site 1240.
T10. Age-depth control points.
T11. Distribution of calcareous nannofossils.
T12. Distribution of planktonic foraminifers.
T13. Distribution of diatoms.
T14. Determinations of polarity chron boundaries.
T15. Paleomagnetic age control points.
T16. Headspace gases concentrations and C1/C2 ratios.
T17. Interstitial water geochemical data.
T18. IC, CaCO3, TC, TOC, TOC CFB, TN, and TOC/TN ratios.
T19. Results of Rock-Eval pyrolysis analyses.
T20. Age-depth model, LSR, and MAR.
![]() Figures F1-F20
Figures F1-F20
![]() Figures
F21-F32
Figures
F21-F32
![]() Tables
T1-T20
Tables
T1-T20