![]() Figures F1-F20
Figures F1-F20
![]() Figures
F21-F32
Figures
F21-F32
![]() Tables
T1-T20
Tables
T1-T20
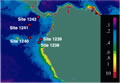
F1. Sites 1238-1242 and regional bathymetry.
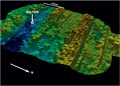
F2. High-resolution swath bathymetry.
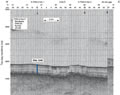
F3. Seismic profile at Site 1240.
F4. Upper-ocean features of the eastern tropical Pacific.
F5. Chlorophyll distributions in surface waters.
F6. Meridional cross section of water masses.
![]()
F7. Modern ocean properties at backtrack locations of Site 1240.
F8. OSUS-MS vs. mcd.
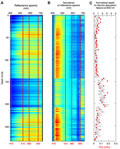
F9. Smoothed spliced records of NGR, GRA density, and MS.
F10. Smoothed spliced records of L*, a*, and b*.
F11. A comparison of the mbsf and mcd scales.
F12. Lithostratigraphic summary.
F13. Major components in smear slides.
F14. Physical properties measurements.
F15. Sequential depth plots, Site 1240.
F16. Bioturbation.
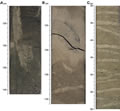
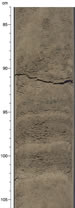
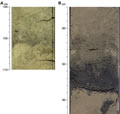
F17. Color banding.
F18. Ash layers.
F19. Color measurements.
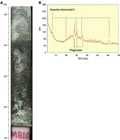
F20. Sediment above basaltic basement.
![]() Figures F1-F20
Figures F1-F20
![]() Figures
F21-F32
Figures
F21-F32
![]() Tables
T1-T20
Tables
T1-T20