![]() Figures F1-F20
Figures F1-F20
![]() Figures
F21-F40
Figures
F21-F40
![]() Figures
F41-F51
Figures
F41-F51
![]() Table T1-T22
Table T1-T22
F1. Bathymetric map.

F2. Lithostratigraphic summary.

F3. Carbonate nodule.
F4. Biogenic opal-rich clay.
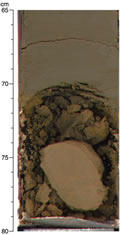
F5. Turbidite.
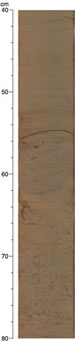
F6. Ash layer.

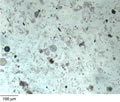
F7. Glass shards.

F8. XRD profile.

F9. Carbonate color change.
F10. Calcite needles.

F11. Glauconite.

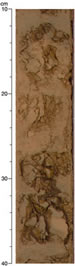
F12. Mousselike texture and sediment disruption.

F13. Age-depth plots.
F14. Concentration profiles of various dissolved species.
F15. Chloride concentration profile.
F16. Profile of the lithium to chloride concentration ratio.
F17. Estimates of gas hydrate.
F18. Comparison of the chloride concentration profiles, Sites 1244.
F19. Sulfate concentration profile.

F20. Dissolved sulfate and barium profiles.
![]() Figures F1-F20
Figures F1-F20
![]() Figures
F21-F40
Figures
F21-F40
![]() Figures
F41-F51
Figures
F41-F51
![]() Table T1-T22
Table T1-T22