![]() Figures F1-F20
Figures F1-F20
![]() Figures
F21-F40
Figures
F21-F40
![]() Figures
F41-F51
Figures
F41-F51
![]() Table T1-T22
Table T1-T22
F21. Concentrations of C1, C2, and C3 vs. depth.
F22. C1/C2 ratio vs. depth.
F23. C1/C2 ratio vs. temperature.
F24. Dissolved residual methane and sulfate.
F25. Contents of IC, CaCO3, OC, TS, and TN, and C/N ratios.

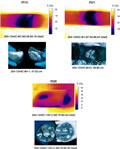
F26. IR images and photographs of corresponding hydrates.
F27. IR downcore temperature profiles.
F28. Downcore temperature anomalies.
F29. Physical property measurements.
F30. GRA, MAD, and LWD density.
F31. Comparison of shallow measurements of bulk density from GRA and MAD.
F32. VP.
F33. Physical property data.
F34. Raw data for estimating in situ temperatures.
F35. Subsurface temperatures plotted vs. depth.
F36. Volume-time plots.
F37. Methane concentrations.

F38. FPC core gamma density profile.

F39. Quality control LWD logs.
F40. LWD data.

![]() Figures F1-F20
Figures F1-F20
![]() Figures F21-F40
Figures F21-F40
![]() Figures
F41-F51
Figures
F41-F51
![]() Table T1-T22
Table T1-T22