![]() Figures F1-F20
Figures F1-F20
![]() Figures
F21-F40
Figures
F21-F40
![]() Figures
F41-F58
Figures
F41-F58
![]() Tables
T1-T23
Tables
T1-T23
F21. Diatom and nannofossil event marker species.
F22. Age-depth plots.
F23. Concentration profiles of dissolved species.
F24. Chloride estimates of gas hydrates.
F25. High-resolution analyses of chloride content.
F26. Sulfate and methane concentration profiles.
F27. Authigenic carbonate formation zone.
F28. Lithium concentrations.
F29. Concentrations of C1, C2, and C3 vs. depth.
F30. Dissolved methane and sulfate.
F31. Light hydrocarbons from void gas vs. depth.
F32. C1/C2 ratio vs. depth.
F33. C1/C2 ratio vs. temperature.
F34. Contents of IC, CaCO3, OC, TS, and TN and C/N ratios.
F35. Downcore IR temperature profile.
F36. IR temperature anomalies and Sw.
F37. Overview of physical properties.
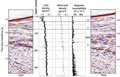
F38. Physical properties and the seismic record.
F39. Physical properties across Horizon A.
F40. NCR.
![]() Figures F1-F20
Figures F1-F20
![]() Figures
F21-F40
Figures
F21-F40
![]() Figures
F41-F58
Figures
F41-F58
![]() Tables
T1-T23
Tables
T1-T23