![]() Figures F1-F20
Figures F1-F20
![]() Figures
F21-F40
Figures
F21-F40
![]() Figures
F41-F58
Figures
F41-F58
![]() Tables
T1-T23
Tables
T1-T23
F41. VP, bulk density, NCR, and shear strength.
F42. In situ temperatures.
F43. Subsurface temperatures.
F44. Volume-pressure-time plots for the PCS.
F45. Porosity of sediments in APC, XCB, and PCS cores.
F46. Methane concentrations.
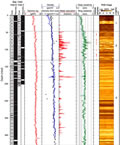
F47. Quality control LWD logs.
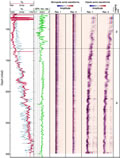
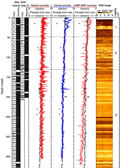
F48. Summary of LWD log data.
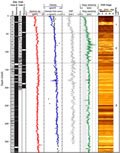
F49. CWL logging data.
F50. CWL gamma ray logging data.
F51. Comparison of LWD and CWL data.
F52. CWL acoustic logging data.
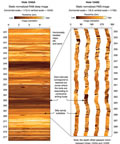
F53. RAB image showing the possible presence of gas hydrate.
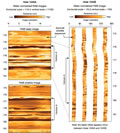
F54. RAB and FMS images showing seismic Horizon A.
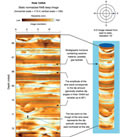
F55. RAB and FMS images showing turbidites.
F56. Comparison of LWD and core-derived porosities.
F57. LWD-derived water saturations.
F58. Borehole temperatures recorded with the TAP tool.
T1. Coring summary.
T2. Variation of minor lithologies.
T3. Gas hydrate samples and depths.
T4. Bioevents found.
T5. Concentrations of dissolved species in pore waters.
T6. Concentration of dissolved chloride.
T7. Concentrations of C1, C2, and C3.
T8. Concentrations of light hydrocarbon and nonhydrocarbon gases.
T9. Gas from decomposed gas hydrate.
T10. Composition of PCS gas samples.
T11. IC, TOC, TN, and TS, and C/N ratios in sediments.
T12. Rock-Eval pyrolysis of samples.
T13. Intervals sampled for microbiology.
T14. Core quality indicators.
T15. IR anomalies.
T16. MAD data.
T17. VP measurements.
T18. Thermal conductivity data.
T19. Shear-strength measurements.
T20. Temperature measurements.
T21. Results from degassing experiments.
T22. HYACINTH pressure coring summary.
T23. Conventional wireline logging.
![]() Figures F1-F20
Figures F1-F20
![]() Figures
F21-F40
Figures
F21-F40
![]() Figures
F41-F58
Figures
F41-F58
![]() Tables
T1-T23
Tables
T1-T23