![]() Figures F1-F20
Figures F1-F20
![]() Figures
F21-F38
Figures
F21-F38
![]() Tables
T1-T18
Tables
T1-T18
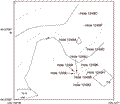
F1. Bathymetric map.
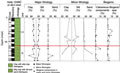
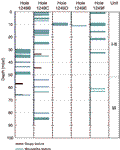
F2. Lithostratigraphic summary.
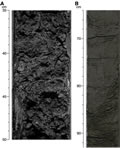
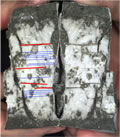
F3. Mottled texture and sulfide precipitates.
F4. Inclined silt layers.
F5. Soupy and mousselike sediments, lithostratigraphic Units I-II and III.
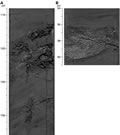
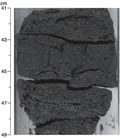
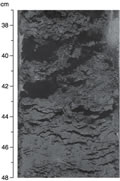
F6. Disrupted sediments.
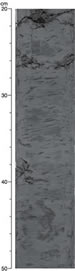
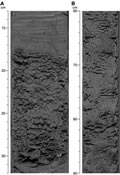
F7. Mousselike textured sediments.
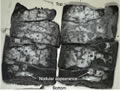
F8. Whole round before and after splitting.
![]()
F9. Split gas hydrate vein.
F10. Cleavage planes.
F11. Sediment after dissociation of hydrate.
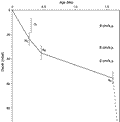
F12. Age-depth plot.
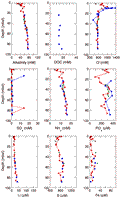
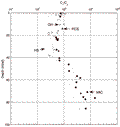
F13. Concentration profiles of various dissolved species.
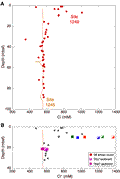
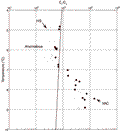
F14. Chloride concentration profile.
F15. Disturbed and undisturbed sediments.
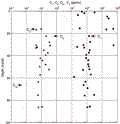
F16. C1, C2, C2=, and C3 vs. depth.
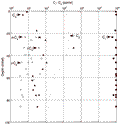
F17. Light hydrocarbons vs. depth.
F18. C1/C2 ratio vs. depth.
F19. C1/C2 ratio vs. temperature.
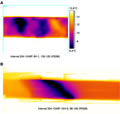
F20. IR images of hydrate.
![]() Figures F1-F20
Figures F1-F20
![]() Figures
F21-F38
Figures
F21-F38
![]() Tables
T1-T18
Tables
T1-T18