![]() Figures F1-F20
Figures F1-F20
![]() Figures
F21-F38
Figures
F21-F38
![]() Tables
T1-T18
Tables
T1-T18
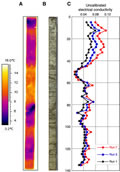
F21. IR temperature profiles.
F22. IR temperature anomalies compared to Sw from LWD.
F23. Overview of physical properties.
F24. Comparison of physical properties with 3-D seismic data.
F25. Hydrate dissociation experiment.
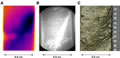
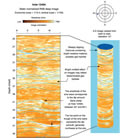
F26. Vein or layer of hydrate.
F27. Estimating in situ temperature.
F28. Subsurface temperatures plotted vs. depth.
F29. Volume-pressure-time plots for PCS.
F30. Methane concentrations.
F31. Density profiles of HRC 5.
F32. Density profiles of HRC 7.
F33. Density profiles of FPC 10.
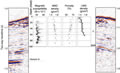
F34. Quality control LWD logs.
F35. LWD-logging data.
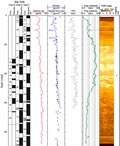
F36. LWD log- and core-derived porosities.
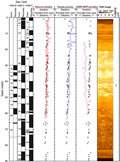
F37. Gas hydrate saturations.
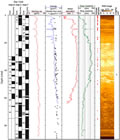
F38. RAB image.
T1. Coring summary.
T2. Core recoveries.
T3. Bioevents.
T4. Dissolved species in pore waters.
T5. Chloride and MAD on wet and dry samples.
T6. Methane, ethane, ethylene, and propane.
T7. Light hydrocarbon and nonhydrocarbon gases.
T8. Gas hydrate-bound gases.
T9. PCS gas samples.
T10. Intervals sampled for microbiology.
T11. Core quality indicators.
T12. Gas hydrate.
T13. MAD properties.
T14. Thermal conductivity.
T15. Temperature measurements.
T16. Degassing experiments.
T17. HYACINTH pressure coring summary.
T18. RAB-8 coring test summary.
![]() Figures F1-F20
Figures F1-F20
![]() Figures
F21-F38
Figures
F21-F38
![]() Tables
T1-T18
Tables
T1-T18