![]() Figures F1-F20
Figures F1-F20
![]() Figures
F21-F40
Figures
F21-F40
![]() Figures
F41-F43
Figures
F41-F43
![]() Tables
T1-T19
Tables
T1-T19
F1. Bathymetric map.
F2. Lithostratigraphic summary, Hole 1250D.
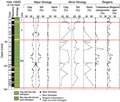
F3. Lithostratigraphic summary, Hole 1250F.

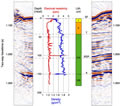
F4. Seismic reflection profile and LWD data.
F5. Distribution of grain-size classes.
F6. Volcanic glass couplet.
F7. XRD record of a carbonate-rich area.
F8. Distribution of biogenic components.
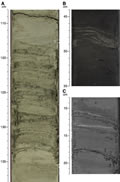
F9. Turbidite sequences located around Horizon Y.
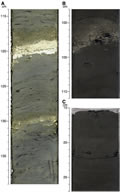
F10. Debris flow deposit.

F11. Volcanic glass-rich layers.
F12. Distribution of volcanic glass.

F13. Color reflectance and MS.
F14. Mousselike and soupy textures.
F15. Age-depth plot.
F16. Concentration profiles of various dissolved species.
F17. Chloride concentrations and gas hydrate.
F18. Dissolved lithium data.

F19. C1, C2, C2=, and C3.

F20. Light hydrocarbons vs. depth.
![]() Figures F1-F20
Figures F1-F20
![]() Figures
F21-F40
Figures
F21-F40
![]() Figures
F41-F43
Figures
F41-F43
![]() Tables
T1-T19
Tables
T1-T19