![]() Figures F1-F20
Figures F1-F20
![]() Figures F21-F40
Figures F21-F40
![]() Figures F41-F47
Figures F41-F47
![]() Tables T1-T20
Tables T1-T20
F21. C1/C2 ratio vs. depth.
F22. IC, OC, TN, and TS and C/N ratios.
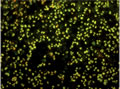
F23. DAPI-stained "slime".
F24. Cold-spot anomalies.
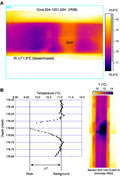
F25. Downcore temperatures.
F26. Negative temperature anomalies.
F27. Downcore temperatures from IR scans.
F28. Downcore temperature and chlorinity values.
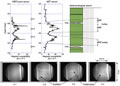
F29. Physical properties.
F30. Correlation between the seismic record and physical properties.
F31. MS anomaly.
F32. NCR.
F33. Comparison of normalized bulk density and thermal conductivity.
F34. In situ temperatures.
F35. Subsurface temperatures.
F36. Volume-pressure-time plots for the PCS.
F37. Methane concentration.
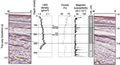
F38. Quality control LWD logs.
F39. LWD data.

F40. CWL data.
![]() Figures F1-F20
Figures F1-F20
![]() Figures F21-F40
Figures F21-F40
![]() Figures F41-F47
Figures F41-F47
![]() Tables T1-T20
Tables T1-T20