![]() Figures F1-F20
Figures F1-F20
![]() Figures F21-F40
Figures F21-F40
![]() Figures F41-F47
Figures F41-F47
![]() Tables T1-T20
Tables T1-T20
F41. CWL gamma ray logging data.
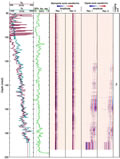
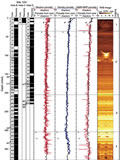
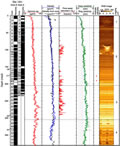
F42. LWD and CWL downhole logging data.
F43. CWL acoustic logging data.
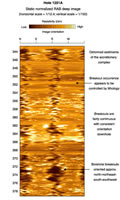
F44. RAB image showing borehole breakouts.
F45. LWD- and core-derived porosities.
F46. LWD-derived water saturations.
F47. TAP tool temperatures.
T1. Coring summary.
T2. Carbonate samples in lithostratigraphic Unit III.
T3. Bioevents.
T4. Dissolved species in pore waters.
T5. Methane, ethane, and propane in HS samples.
T6. Light hydrocarbon and nonhydrocarbon gases in VAC samples.
T7. Gas composition of samples from PCS experiments.
T8. IC, OC, TN, TS, and C/N ratios.
T9. Rock-Eval pyrolysis.
T10. Intervals sampled for microbiology.
T11. Core quality indicators.
T12. Gas hydrate.
T13. MAD index sample values.
T14. VP.
T15. Thermal conductivity values.
T16. Shear strength values.
T17. Temperature measurements.
T18. Results from degassing experiments.
T19. HYACINTH pressure coring summary.
T20. CWL operations summary.
![]() Figures F1-F20
Figures F1-F20
![]() Figures F21-F40
Figures F21-F40
![]() Figures F41-F47
Figures F41-F47
![]() Tables T1-T20
Tables T1-T20