![]() Figures F1-F20
Figures F1-F20
![]() Figures F21-F40
Figures F21-F40
![]() Figures F41-F47
Figures F41-F47
![]() Tables T1-T20
Tables T1-T20
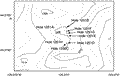
F1. Bathymetric map.
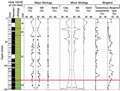
F2. Lithostratigraphic summary.
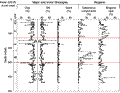
F3. Major and minor lithologies.
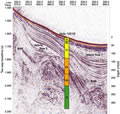
F4. Seismic reflection profile.
F5. Seismic reflection profile.
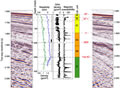
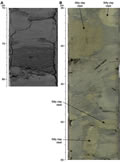
F6. Turbidites and soft clasts.
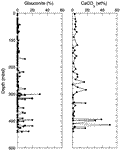
F7. Glauconite and CaCO3 vs. depth.
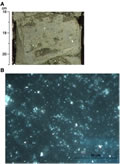
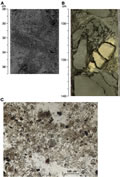
F8. Foraminifer-rich clay.
F9. Glauconite and carbon-rich clay.
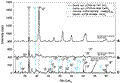
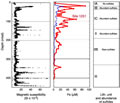
F10. XRD records.
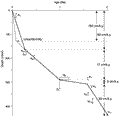
F11. Age-depth plot.
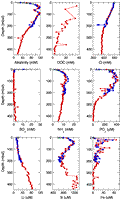
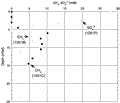
F12. Concentration profiles of various dissolved species.
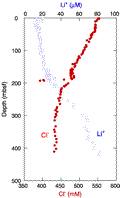
F13. Distribution of dissolved chloride and lithium.
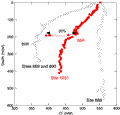
F14. Chloride distribution.
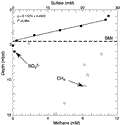
F15. Sulfate and methane concentration profile.
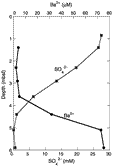
F16. Dissolved sulfate and barium profiles.
F17. Downcore variations in MS.
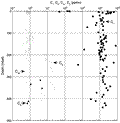
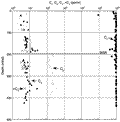
F18. C1, C2, C2=, and C3.
F19. Dissolved residual methane and sulfate.
F20. Light hydrocarbons vs. depth.
![]() Figures F1-F20
Figures F1-F20
![]() Figures F21-F40
Figures F21-F40
![]() Figures F41-F47
Figures F41-F47
![]() Tables T1-T20
Tables T1-T20