![]() Figures F1-F20
Figures F1-F20
![]() Figures F21-F38
Figures F21-F38
![]() Tables T1-T22
Tables T1-T22
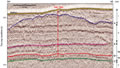
F1. Seismic line GeoB215.
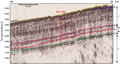
F2. Seismic line 207-L1S.
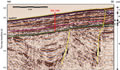
F3. Multichannel seismic reflection line C2211.
F4. Carbonate and TOC.
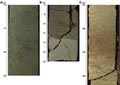
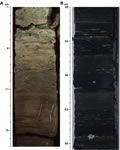
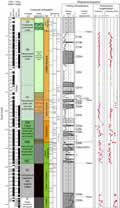
F5. Representative lithologies, Units II and III.
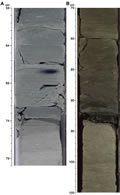
F6. Lithology transitions at P/E and K/T boundaries.
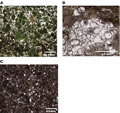
F7. Representative lithologies, Unit III.
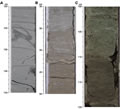
F8. Representative lithologies, Unit IV.
F9. Typical lithologies, Units IV and V.
F10. Planktonic foraminifer, calcareous nannofossil, and radiolarian biozonation.
F11. Shipboard paleomagnetic data.
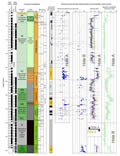
F12. Shore-based magnetostratigraphy.
F13. Composite and spliced spectral reflectance.
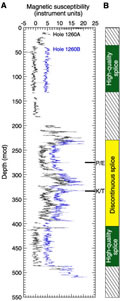
F14. Composite and spliced magnetic susceptibility.
F15. Composite and spliced GRA bulk density
F16. Magnetic susceptibility data.
F17. Age-depth plot.
F18. Rock-Eval van Krevelen–type diagram.
F19. Headspace gas and microbial methane.
F20. TOC vs. interstitial methane.