![]() Figures F1-F12.
Figures F1-F12.
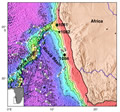
F1. Locations of Sites 1081, 1082, and 1084.
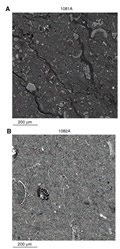
F2. SEM microstructure images.
F3. Log density data, Hole 1081A.
F4. Power spectra of log density in the depth domain.
F5. Sedimentation rates vs. depth for Sites 1081, 1082, and 1084.

F6. Sedimentation rates vs. age at Sites 1081, 1082, and 1084.
F7. Spectral power in the time domain, Sites 1081, 1082, and 1084.
F8. Spectral energy detected in log density profiles over time, Sites 1081, 1082, and 1084.
F9. Synthetic sedimentation rates of sediment composites.
F10. Parameters that influenced results from spectral analyses.
F11. Evolutionary spectra with depth.
F12. Evolutionary spectra from synthetic density profiles.
