F1. Bathymetric map and morphologic elements of Drifts 6 and 7.
F2. Part of MCS reflection profile I95-137 across Site 1095.

F3. 3.5-kHz sub-bottom profile across Site 1095.
F4. Simplified lithostratigraphy of Site 1095.
F5. Comparison of downhole sedimentological data from smear slides for Site 1095.
F6. Alternation of diatomaceous facies and terrigenous facies in Subunit IA.
F7. Alternation of silty clay with sand grains, and clay with silt laminae.
F8. Burrow-mottled silty clay with dispersed sand grains and foraminifers.
F9. Clay with silt laminae 1-8 mm thick.

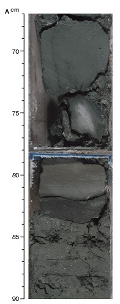
F10. Representative photographs of lithofacies in Unit II.

F11. Schematic representation of internal structure of Facies L1-L3 at Site 1095.
F12. Lithofacies types in Unit III.
F13. Schematic representation of a distal turbidite depositional setting.
F14. Summary of the occurrence of diatoms, radiolarians, and planktonic foraminifers at Site 1095.
F15. Sedimentation rates based on radiolarian occurrences, Site 1095.
F16. Inclinations and declinations from Holes 1095A and 1095B.
F17. Orthogonal projection, change in intensity, and equal-area projection of the remanence vector.
F18. Vector end-point diagram showing the removal of the drill string overprint for Sample 178-1095B-4H-4, 71 cm.

F19. Inclinations measured on archive halves and discrete samples.
F20. Inclination of the magnetization vector vs. depth for Holes 1095A, 1095B, and 1095D after AF demagnetization.
F21. Intensity of the magnetization vector vs. depth for Holes 1095A, 1095B, and 1095D after AF demagnetization.
F22. Inclinations from split cores and from discrete samples.

F23. Vector end-point diagram from the reversed polarity interval above Cryptochron 4r.2r-1.

F24. Vector end-point diagram from the transition zone between the cryptochron and reversed polarity interval.

F25. Vector end-point diagram from a sample within Cryptochron 4r.2r-1.
F26. Vector end-point diagram for a thermally demagnetized sample within Cryptochron 4r.2r-1.
F27. Intensity and MST susceptibility for the interval 395-414 mbsf.
F28. Methane distribution at Site 1095.
F29. Profiles of interstitial water chemistry in Holes 1095A and 1095B.

F30. Calcium carbonate distribution at Site 1095.