![]() Figures F1-F34
Figures F1-F34
![]() Tables T1-T19
Tables T1-T19
F1. Map showing Site 1126 in relation to other Leg 182 sites and the AGSO169 site-survey seismic lines.
F2. Portion of seismic Line AGSO169/03g showing seismic stratigraphic sequences at Site 1126.
F3. Summary of sediments and lithostratigraphy.
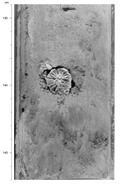
F4. Solitary azooxanthellate coral, Hole 1126B.
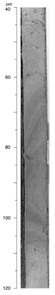
F5. Inclined, deformed beds, Hole 1126B.
F6. Calcareous nannofossil and planktonic foraminifer zones with benthic foraminifer assemblages.
F7. Sedimentation rate curve from datum levels.
F8. Inclination measurements from Core 182-1126B-19H.
F9. AF demagnetization behavior of Sample 182-1126D-33X, 87-89 cm.
![]()
F10. Plots of demagnetization of NRM, ARM, and IRMs and of the acquisition of IRM.
F11. Composite depth section produced using Splicer software.
F12. Spliced section of smoothed color reflectance data produced using Splicer software.
F13.
Spliced and tuned color reflectance record for Site 1126
compared to Site 656 composite seawater ![]() 18O
curve.
18O
curve.
F14. CaCO3 and Corg contents of samples.
F15. Summary of unnormalized anion trends.
F16. Summary of unnormalized cation trends.
F17. Summary of normalized trends.
F18. Summary trends in the Na+/Cl- ratio with increasing depth.
F19. Downhole variation in the Sr2+/Ca2+ ratio of pore waters.
F20. Variations in mineral concentrations.
F21. GRA densiometry values vs. discrete bulk density measurements.
F22. P-wave velocity, GRA and MAD bulk densities, porosity, magnetic susceptibility and NGR.
F23. GRA and MAD bulk densities, P-wave velocities, and NGR.
F24. Shear strength, Holes 1126B and 1126C.
F25. Thermal conductivity and P-wave velocity.
F26. Geophysical logs vs. depth from triple combo and sonic/GHMT.
F27. Spectral gamma-ray logs from HNGS vs. depth.
F28. Spectral gamma-ray logs vs. depth.
F29. Acoustic impedance vs. depth from density and sonic logs.
F30. Seismic site-survey tracks for Site 1126 in relation to other Leg 182 sites and the AGSO169 site-survey seismic lines.
F31. Portion of seismic Line AGSO169/03g showing seismic stratigraphic sequences.
F32. Check-shot stations and acquisition geometry for the WST survey.
F33. Predicted and corrected depths and interval velocities.
F34. Lithostratigraphic units, seismic sequences, biostratigraphic hiatuses, and ages.
T1. Site 1126 coring summary.
T2. Datum levels used in the graph of sedimentation rate.
T3. Site 1126 core and section depths in mcd and mbsf.
T4. Biostratigraphic data used for splice correlation.
T5. Splice tie points.
T6. Hydrocarbon gas compositions.
T7. C, N, and S data.
T8. Interstitial water geochemistry.
T9. XRD data.
T10. P-wave velocity measurements.
T11. GRA-densiometry measurements.
T12. Magnetic susceptibility measurements.
T13. Natural gamma-ray measurements.
T14. Thermal conductivity measurements.
T15. Discrete P-wave velocity measurements.
T16. Index properties measurements.
T17. Undrained shear strength measurements.
T18. Tool strings, intervals logged, and logging speeds, Hole 1126D.
T19. Differences between depths to key horizons and corrected depths.