![]() Figures F1-F38
Figures F1-F38
![]() Tables
T1-T18
Tables
T1-T18
F1. Smoothed/correlated MS data and splice.
F2. Smoothed/correlated NGR data and splice.
F3. Smoothed/correlated GRA data and splice.
F4. Smoothed/correlated L* values from the CSR data and splice.
F5. Site 1148 section summary.
F6. "Iron sulfide," pyrite concretions, and green layers,.
F7. Density of light-colored, carbonate-rich layers.
F8. Dark, graded tephra layer.
F9. Carbonate sand turbidite.
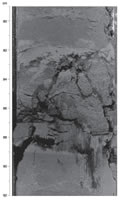
F10. Strongly bioturbated lithologic boundary.
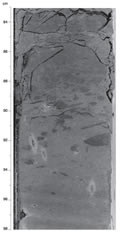
F11. Plastic, soft-sediment deformation.
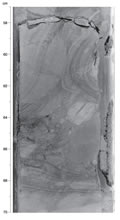
F12. Small-scale normal faulting.
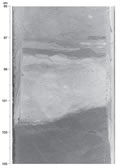
F13. Flaser-bedded sandstone laminae.
F14. Variation of bulk mineralogy.
F15. Age-depth plot.
F16. Declination and inclination for Hole 1148A, 0-180 mcd.
F17. Declination and inclination for Hole 1148B, 0-150 mcd.
F18. Age-depth model, LSR, and MAR.
F19. Carbonate, TOC, and organic C/N ratio at Site 1148 vs. depth.
F20. Methane, ethane, and propane concentrations and C1/C2 ratio vs. depth.
F21. Rock-Eval pyrolysis results for samples from Cores 184-1148A-64X through 75X.
F22. Interstitial water measurements.
F23. Plot of Mg2+ vs. Ca2+.
F24. Magnetic susceptibility measurements.
F25. Natural gamma radiation measurements.
F26. Bulk density measurements from GRA and MAD methods.
F27. Porosity, grain density, and dry density values.
F28. Color spectral reflectance measurements.
F29. P-wave velocity measurements for Hole 1148A.
F30. Thermal conductivity measurements.
F31. Downhole temperature measurements.
F32. Downhole temperature gradient.
F33. Graphic summary of downhole logging operations for Hole 1148A.
F34. Downhole logs of hole diameter from Hole 1148A.
F35. Downhole logs of HSGR, HCGR, potassium, thorium, and uranium.
F36. Comparison of core MAD porosity, downhole log bulk density porosity, GR, and P-wave velocity.
F37. MS from MST measurements of core logs vs. downhole measurements of thorium.
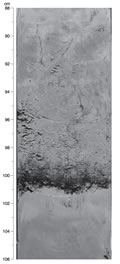
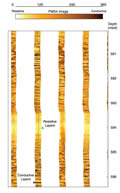
F38. FMS image from downhole logging data.
T1. Site 1148 coring summary.
T2. Site 1148 coring summary by section.
T3. Composite depths.
T4. Site 1148 splice tie points.
T5. Light-colored, carbonate-rich layers.
T6. Volcanic ash layers.
T7. Summary of biohorizons.
T8. Calcareous nannofossil checklist.
T9. Planktonic foraminifer checklist.
T10. Age-depth relationship from the magnetic polarity time scale.
T11. Sedimentation and accumulation rates for selected intervals.
T12. Methane, ethane, ethene, propane, butane, and pentane concentrations, Hole 1148A.
T13. Methane, ethane, ethene, propane, butane, and pentane concentrations, Hole 1148B.
T14. IC, CaCO3, TC, TOC, TN, and TS contents.
T15. Rock-Eval pyrolysis results for selected samples, Hole 1148A.
T16. Interstitial water composition.
T17. Thermal conductivity measurements.
T18. Summary of logging operations.