![]() Figures F1-F28
Figures F1-F28
![]() Table
T1
Table
T1
F1. Lambert Glacier drainage basin.
F2. Model of trough mouth fan deposition.
F3. Bathymetric features of and ODP sites in Prydz Bay.
F4. Generalized map of circulation in the Prydz Bay region.
F5. Pre-Mesozoic geology of the Lambert Glacier drainage basin.
F6. Structure contour map of the top of basement in Prydz Bay.
F7. Top of the Lower Cretaceous structure contour map.
F8. Sketch of seismic sequences drilled during Leg 119.
![]()
F9. Isopach map of postsurface PP12 sediments.
F10. Maps of Leg 188 drill sites and East Antarctic coastline.
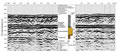
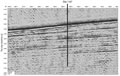
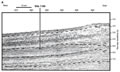
F11. Seismic reflection profile over Site 1166.
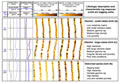
F12. Composite stratigraphic section for Site 1166.
F13. Plots showing biostratigraphic age control and magnetostratigraphic polarity intervals.
F14. Downhole wireline logs of Site 1166.
F15. Examples of FMS resistivity images.
F16. Diagrams of the Prydz Bay region from preglacial through full glaciation.
F17. Seismic reflection profile over Site 1167.
F18. Site 1167 lithostratigraphic units, facies, and interpretation.
F19. Distribution and frequency of sandstone vs. granite/igneous lonestones.
F20. Plots showing magnetostratigraphy, magnetic susceptibility, and ARM/IRM.
F21. Plots of chloride and sulfate interstitial water values.
F22. Seismic reflection profile across Site 1165.
F23. Composite stratigraphic section for Site 1165.
F24. Magnetostratigraphy for Site 1165.
F25. Age-depth plot for Site 1165.
F26. Organic gases and carbon in Holes 1165B and 1165C.
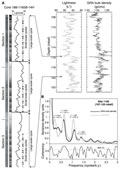
F27. Example of cyclicity observed at Site 1165.
F28. Conceptual diagrams showing changes in glacial erosion and sedimentation on the Antarctic continental margin.
T1. Leg 188 site summary.