![]() Figures F1-F49
Figures F1-F49
![]() Tables
T1-T10
Tables
T1-T10
![]() Table
TA1
Table
TA1
F1. Location of Site 1166.
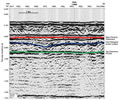
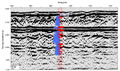
F2. Seismic line BMR 33-23P3 at Site 1166 showing major surfaces.
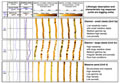
F3. Lithostratigraphic units, subunits, and interpretation.
F4. Composite stratigraphic section.
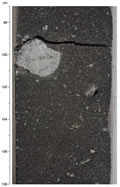
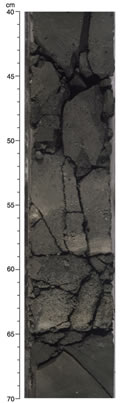
F5. Diamicton typical of Subunit IB.
F6. Upper contact of interbedded clays and diatom clays of Subunit IC.
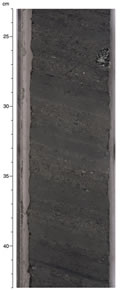
F7. Interbedded clays and diatom clays of Subunit IC.
F8. Decimeter-scale interbedded clays and sands of Unit II.
F9. Graded sand bed in the upper portion of Unit II.
F10. Centimeter-scale interbedded clays and sands of Unit II.
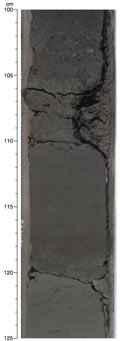
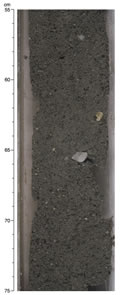
F11. Homogeneous coarse sands typical of the upper portion of Unit III.
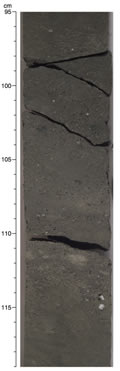
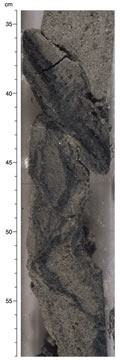
F12. Deformed coarse sands typical of the lower portion of Unit III.
F13. Deformed sands and organic detritus within Unit III.
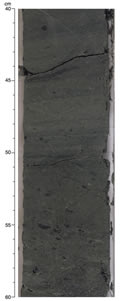
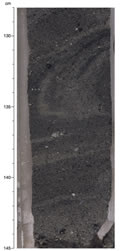
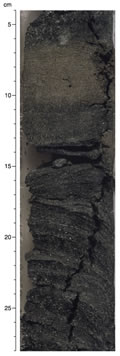
F14. Laminated micaceous silt and organic detritus typical of Unit IV.
F15. Combined percentages of muscovite and biotite mica.
F16. X-ray diffractograms of clay-sized fractions of sediment from Cores 188-1166A-12R and 13R.
F17. X-ray diffractograms of clay-sized fractions of sediment from Cores 188-1166A-14R and 15R.

F18. X-ray diffractograms of clay-sized fractions of sediment from Cores 188-1166A-24R and 32R.
F19. Core recovery, lithostratigraphic units, magnetostratigraphy, and biostratigraphic zones for Hole 1166A.
F20. Age-depth plot for Hole 1166A.
F21. Downhole variation of concentration-dependent parameters in Hole 1166A.
F22. IRM acquisition curves for four representative samples from Hole 1166A.
F23. Thermal demagnetization of a composite three-axis IRM for two representative samples.
F24. Vector component diagrams of demagnetization behavior of four samples from Hole 1166A.
F25. Histogram of paleomagnetic inclinations from Hole 1166A.
F26. Magnetostratigraphic record from Hole 1166A.
F27. Downcore profiles of sulfate and ammonium.
F28. Downcore profiles of calcium and magnesium, strontium, lithium, and manganese.
F29. Downcore profiles of silica, alkalinity, potassium, and phosphate.
F30. Downcore profiles of sodium, chloride, and salinity.
F31. Weight percent of inorganic carbon and organic carbon in sediments.
F32. Bulk mineralogy from XRD and NGR vs. depth.
F33. Grain density and porosity from discrete measurements.
F34. Bulk density and dry density from discrete measurements.
F35. Water content and void ratio from discrete measurements.
F36. Discrete velocity measurements obtained with the PWS.
F37. Measurements of undrained shear strength using the fall cone and pocket penetrometer.
F38. Normalization of undrained shear strength with respect to effective overburden pressure.
F39. Thermal conductivity measurements and dry densities.
F40. Logging summary diagram showing log, pipe, and seafloor depths.
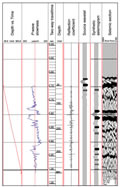
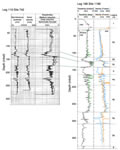
F41. Density, porosity, resistivity, and sonic velocity logs, with the logging units marked.
F42. Total gamma-ray, potassium, thorium, uranium, photoelectric effect, and magnetic susceptibility logs.
F43. Representative examples of FMS images from Hole 1166A.
F44. Detail of the P-wave velocity log in logging Units 3 and 4.
F45. P-wave slowness log, source wavelet, and synthetic seismogram for Hole 1166A.
F46. The synthetic seismogram and P-wave slowness log overlaid on seismic line BMR33-23B.
F47. Correlation of resistivity and sonic velocity logs between Sites 1166 and 742.
F48. Processed GHMT logs.
F49. Temperature of the borehole fluid vs. depth.
T1. Coring summary.
T2. Expanded coring summary that includes length and depths of sections and comments on sampling.
T3. Diatom and radiolarian biostratigraphic datums from Hole 1166A.
T4. Interstitial water chemistry from shipboard measurements.
T5. Carbon, nitrogen, and sulfur analyses of sediments.
T6. Organic carbon and Rock-Eval pyrolysis on selected samples.
T7. Discrete P-wave measurements.
T8. Measurements of undrained shear strength.
T9. Measurements of thermal conductivity.
T10. Logging operations summary.
AT1. Summary of accessory components identified in foraminiferal residues.
![]() Figures F1-F49
Figures F1-F49
![]() Tables
T1-T10
Tables
T1-T10
![]() Table
TA1
Table
TA1