![]() Figures F1-F43
Figures F1-F43
![]() Tables
T1-T23
Tables
T1-T23
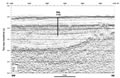
F1. Postdrilling interpretation for local seismic profile AGSO 125-4, across Site 1172.
F2. Conceptual regional cross section through time across Site 1172.
F3. A portion of multichannel seismic profile AGSO 202-13 through Site 1172.
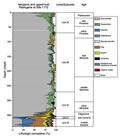
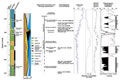
F4. Summary of Holes 1172A to 1172D.
F5. Detailed summary of the 0-766.5 mbsf interval, Holes 1172A to 1172D.
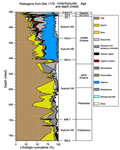
F6. Results of smear-slide analyses of Neogene and uppermost Paleogene sediments.
F7. Stained bands in late Miocene-age nannofossil ooze.
F8. Close-up photograph of strong bioturbation in early middle Miocene-age nannofossil ooze.
F9. Close-up photograph of the lithification of the carbonate succession.
F10. Results of smear-slide analyses with the lithologic composition of Paleogene sediments.
F11. Close-up photograph of abundant Zoophycos traces.
F12. Close-up photograph of another distinct lithologic change that may represent the K/T boundary.
F13. Compilation of lithologic and stratigraphic information on Core 189-1172D-39X sediments.
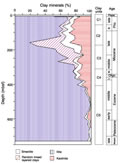
F14. Clay mineral units.
F15. Age-depth plot and linear sedimentation rates.
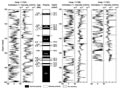
F16. Long-core measurements from 0 to 100 mbsf.
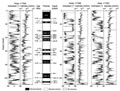
F17. Long-core measurements from 100 to 200 mbsf.
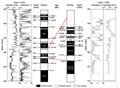
F18. Long-core measurements from 200 to 300 mbsf, Hole 1172A.
F19. Long-core measurements from 300 to 400 mbsf, Holes 1172A and 1172D.
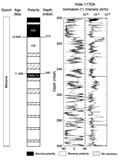
F20. Recovery of magnetostratigraphy from z-intensity, Hole 1172D.
F21. Variation of magnetic properties, Holes 1172A and 1172D.
F22. Age-depth relationship from paleomagnetic data for the Cenozoic, Hole 1172B.
F23. Smoothed spectral reflectance and magnetic susceptibility data for the upper 140 mcd.
F24. Smoothed GRA bulk density, spectral reflectance, and magnetic susceptibility data for the Eocene/ Oligocene boundary interval.
F25. Plots of carbonate, total organic carbon, total nitrogen, C/N ratios, and hydrogen index values.
F26. Total sulfur content compared to C/S ratios.
F27. Headspace gas analysis.
F28. Concentration-depth profiles for interstitial water chemistry.
F29. Crossplots of Mg2+ vs. Ca2+ for Hole 1172A and Ca2+ vs. Li+, Holes 1172A and 1172D.
F30. Magnetic susceptibility, GRA density, and wet bulk density vs. depth, Holes 1172A and 1172D.
F31. P-wave velocities measured for discrete samples and in whole cores vs. depth, Hole 1172A.
F32. P-wave velocities measured for discrete samples vs. depth, Hole 1172A.
F33. Thermal conductivity vs. depth measured on whole cores.
F34. Wet bulk density, water content, and porosity measured at discrete intervals vs. depth.
F35. Temperature vs. depth.
F36. Undrained shear strength from miniature vane-shear measurements and GRA density vs. depth, Hole 1172A.
F37. Details of the logging operations, Hole 1172D.
F38. Caliper, gamma-ray, resistivity, and magnetic susceptibility values, Hole 1172D.
F39. Velocity, density, porosity, and photoelectric effect values, Hole 1172D.
F40. Total gamma-ray and spectral gamma-ray values, Hole 1172D.
F41. Downhole log bulk density plotted with core bulk density.
F42. Downhole neutron porosity plotted with core porosity.
F43. Downhole P-wave velocities from the logs.
T1. Coring summary.
T2. Lithostratigraphic summary.
T3. Stratigraphic distribution of selected nannofossil species.
T4. Calcareous nannofossil datum levels.
T5. Range chart of planktonic foraminifers.
T6. Selected planktonic foraminiferal datums.
T7. Selected radiolarian datums.
T8. Relative abundance of selected diatom taxa, sponge spicules, and silicoflagellates, Holes 1172A and 1172D.
T9. Diatom bioevents, Holes 1172A and 1172D.
T10. Distribution of organic walled dinocysts and sporomorph percentages, Holes 1171A and 1172D.
T11. Selected dinocyst datums, Holes 1172A and 1172D.
T12. Age-diagnostic biostratigraphic events.
T13. Magnetostratigraphic results.
T14. Composite depth section.
T15. Splice tie points.
T16. Values for inorganic carbon, calcium carbonate, total carbon, total organic carbon, total nitrogen, total sulfur, hydrogen, and C/N and C/S ratios.
T17. Results of Rock-Eval analyses.
T18. Headspace gas composition.
T19. Interstitial water data.
T20. P-wave velocities measured at discrete intervals.
T21. Thermal conductivity measured on whole-core sections, Hole 1172A.
T22. Undrained shear strength from miniature vane-shear measurements, Hole 1172A.
T23. Index properties measured at discrete intervals, Hole 1172A.