![]() Figures F1-F48
Figures F1-F48
![]() Tables
T1-T23
Tables
T1-T23
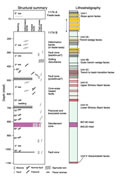
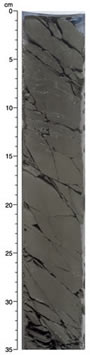
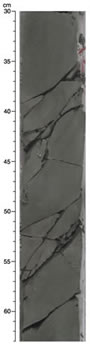
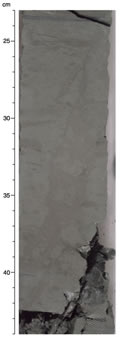
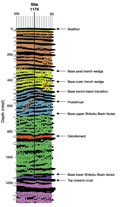
F1. Stratigraphic column.
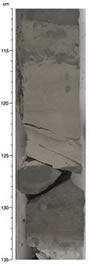
F2. Medium- to fine-grained graded sand and mud chips in Subnit IIA.
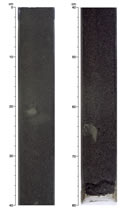
F3. Granule fragments in sand from Subunit IIA.
F4. Silty claystone from Subunit IIB containing the trace fossil Chondrites.
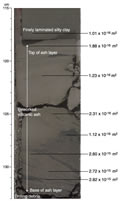
F5. Two volcanic ash layers from the upper Shikoku Basin.
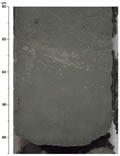
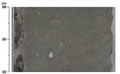
F6. Silty claystone with foraminifers from the lower Shikoku Basin.
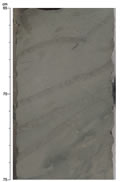
F7. Silty claystone with the trace fossil Zoophycos.
F8. Distribution and thickness of volcanic ash layers, Sites 1173 and 1174.
F9. Abundances of clay minerals, quartz, plagioclase, and calcite.
F10. X-ray diffractograms of unaltered and altered volcanic ash.
F11. Overall distribution of deformation structures.
F12. Distribution of bedding dips and deformation structures with depth, Hole 1174B.
F13. Deformation bands displaying varying width and the tendency to bifurcate.
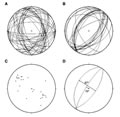
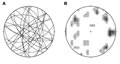
F14. Stereographic projections of deformation bands illustrating the effectiveness of paleomagnetic reorientation.
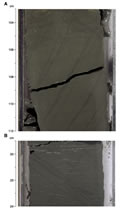
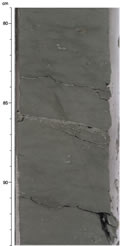
F15. Inclined fractures, part of a deformed horizon that may represent a prism backthrust.
F16. Stereographic projections of fractures related to prism faults.
![]()
F17. Steepened bedding and inclined fractures.
F18. Bifurcating, healed normal fault.
F19. Stereographic projections of core-scale healed faults.
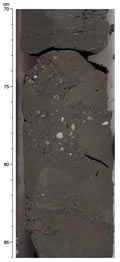
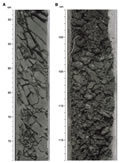
F20. Details of the décollement zone showing breakage into angular blocks and comminution of sediments.
F21. Stereographic projections of structures related to the décollement.
![]()
F22. Details of fracturing across the décollement zone.
F23. Example of a dewatering structure in the underthrust sediments.
F24. Variation of uncalibrated gas-permeameter measurements with depth.
F25. Fine-scale variations in volcanic ash.
F26. Paleomagnetic inclination, declination, and intensity, Hole 1174A.
F27. Zijderveld diagrams of excursions, Hole 1174A.
F28. Magnetic intensity zones, Sites 1174 and 1173.
F29. Rock-magnetic experiments, Hole 1174B.
F30. Magnetostratigraphy.
F31. Age-depth plot.
F32. Magnetic polarity reversals at Sites 1173, 1174, and 808.
F33. Interstitial fluid composition as a function of depth.
F34. Molecular compositions and concentrations of headspace gases.
F35. Total carbon and nitrogen contents and the percentage of inorganic carbon in sediments.
F36. Ratio of C1/(C2+C3) with increasing depth and present-day temperature.
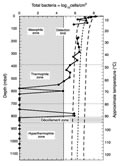
F37. Depth and temperature distribution of total bacterial populations.
F38. Bulk density, grain density, and porosity.
F39. Porosities below the décollement or age-equivalent horizon.
F40. Thermal conductivity and temperature trends.
F41. P-wave velocity and bulk density.
F42. Formation factor and anisotropy of electrical conductivity.
F43. Magnetic susceptibility.
F44. Temperatures measured during the deployment of the Adara temperature tool.
F45. Temperatures measured during the DVTP station.
F46. Measured temperatures, Hole 1174A.
F47. Pressures measured during the DVTP-P station.
F48. Three-dimensional seismic reflection line 281 across Site 1174.
T1. Coring summary.
T2. Coring summary by section.
T3. Stratigraphic relations.
T4. XRD analysis of bulk-powder volcanic ash samples.
T5. Peak intensities and peak areas from XRD analysis.
T6. Normalized relative mineral abundances based on XRD analysis.
T7. Structural data.
T8. Recognized nannofossil events.
T9. Interval and depth constraints of calcareous nannofossil events.
T10. Epoch boundaries.
T11. Calcareous nannofossil range chart (Zones NN21-NN19).
T12. Calcareous nannofossil range chart (Zones NN18-NN6).
T13. Depths and ages of magnetic chrons and subchrons.
T14. Pore fluid composition.
T15. Headspace and vacutainer gas analyses, Hole 1174.
T16. Carbon, nitrogen, sulfur, and hydrogen analyses, Hole 1174.
T17. Total bacterial populations in sediments.
T18. Comparison of near-surface sediment bacterial populations at Site 1174 with data from nine other ODP sites.
T19. Drilling fluid intrusion estimated based on PFT experiments.
T20. Fluorescent microsphere tracer experiments.
T21. Formation factors for Hole 1174A by the needle-probe method.
T22. Electrical conductivity and formation factor for sample cubes.
T23. Summary of downhole temperature measurements, Hole 1174A.