![]() Figures F1-F29
Figures F1-F29
![]() Tables
T1-T19
Tables
T1-T19
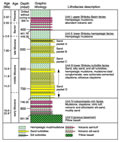
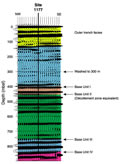
F1. Stratigraphic column.
F2. Distribution and thickness of volcanic-ash layers.

F3. Zoophycos in silty claystone from Unit III.
F4. Wood fragments in silty claystone from Unit III.
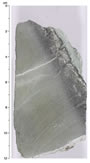
F5. Wood-rich sandy turbidite from Unit III interbedded with silty claystone.
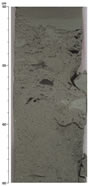
F6. Siliciclastic turbidite from Unit III containing plant material and rip-up clasts.
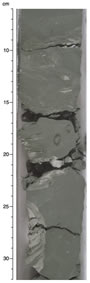
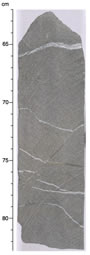
F7. Siliciclastic turbidite from Unit III with rip-up clasts.
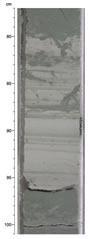
F8. Laminated and bioturbated volcanic ash from Unit IV.
F9. Contorted interbeds of volcanic ash and silty claystone of Unit IV.
F10. Contact between green basal mudstone (Unit IV) and basalt (Unit V).
F11. Abundances of total clay minerals, quartz, plagioclase, and calcite.
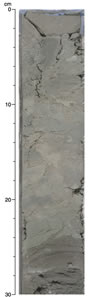
F12. Healed fault and brecciated fracture zone with greenish alteration of claystone.
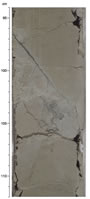
F13. Subhorizontal veins and high-angle fracture in basalt.
F14. Gas-permeameter data plotted logarithmically and linearly.
F15. Paleomagnetic declination, inclination, and intensity.
F16. Magnetostratigraphy.
F17. Age-depth plot.
F18. Pore fluid composition as a function of depth.
F19. Methane and ethane compositions and concentrations of headspace gases and CN ratios.
F20. TOC concentrations.
F21. Depth distribution of total bacterial populations.
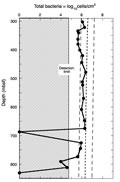
F22. Depth profiles of total bacteria.
F23. Bulk density, grain density, and porosity.
F24. Thermal conductivity.
F25. P-wave velocity and velocity anisotropy.
F26. Formation factor and anisotropy of electrical conductivity.
F27. Magnetic susceptibility.
F28. Natural gamma ray.
F29. Three-dimensional seismic reflection line 281.
T1. Coring summary.
T2. Coring summary by section.
T3. Summary of stratigraphic relations.
T4. Peak intensities and peak areas from XRD analysis.
T5. XRD analysis of volcanic ash.
T6. Mineral abundances based on XRD analysis of bulk-sediment powders.
T7. Structural data.
T8. Recognized nannofossil events.
T9. Interval and depth constraints of calcareous nannofossil events.
T10. Epoch boundaries.
T11. Calcareous nannofossil range chart.
T12. Depths and ages of magnetic chrons and subchrons.
T13. Pore fluid composition, Hole 1177A.
T14. Headspace gas analysis.
T15. Carbon, nitrogen, sulfur, and hydrogen analyses.
T16. Total bacterial populations in sediments.
T17. Drilling fluid intrusion estimated based on PFT experiments.
T18. Fluorescent microsphere tracer experiments.
T19. Electrical conductivity and formation factor.