![]() Figures F1-F50
Figures F1-F50
![]() Figures
F51-F77
Figures
F51-F77
![]() Tables
T1-T14
Tables
T1-T14
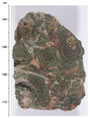
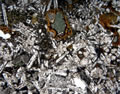
F51. Altered hyaloclastite.
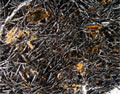
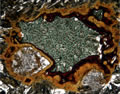
F52. Altered basalt from yellow-brown halo.
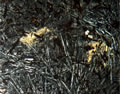
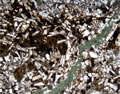
F53. Altered basalt from near calcite veins.
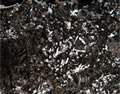
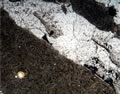
F54. Replacement of basalt.
F55. Pervasively altered angular basalt fragments in breccia.
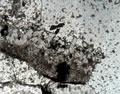
F56. Olivine phenocrysts totally replaced by celadonite.
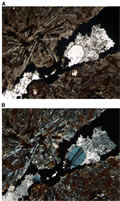
F57. Olive halos and dusky green basalt near calcite-smectite vein.
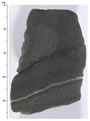
F58. Typical gray, fine-grained basalt.
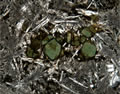
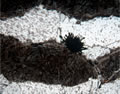
F59. Filled miarolitic voids in basalt.
F60. Large miarolitic cavity.
F61. Altered basalt in yellow-brown halo crossed by celadonite vein.
F62. Vein made up of secondary minerals.
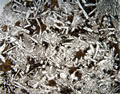
F63. Zeolite screen showing phillipsite.
F64. Euhedral zeolite crystal in secondary vein.
F65. Botryoidal aggregate in calcite vein.
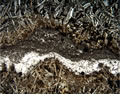
F66. Micritic sediment and sparry calcite vein.
F67. Complex halos near smectite veins.
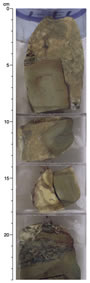
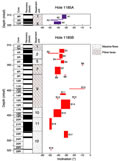
F68. Basement recovery, fracture density, vein abundance, and true dip, Hole 1185A.
F69. Basement recovery, fracture density, vein abundance, and true dip, Hole 1185B.
F70. Zijderveld diagrams for archive-half core measurements.
F71. NP zonation, magnetic polarity data, and correlation with GPTS.
F72. Variations in NRM, magnetic susceptibility, Q-ratio, and MDF.
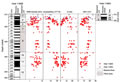
F73. Mean ChRM inclination variation for paleomagnetic units.
F74. Index properties and thermal conductivity vs. depth, Hole 1185A.
F75. Index properties and thermal conductivity vs. depth, Hole 1185B.
F76. Velocity and whole-core measurements vs. depth, Hole 1185A.
F77. Velocity and whole-core measurements vs. depth, Hole 1185B.
T1. Coring summary.
T2. Expanded coring summary.
T3. Lithologic units.
T4. Components in Unit II sediments.
T5. Planktonic foraminifer and calcareous nannofossil occurrences.
T6. Turnover in abyssal benthic foraminifer assemblages.
T7. Unit boundary thicknesses and characteristics.
T8. Geochemical data for rock samples, Site 1185.
T9. ChRM direction, NRM intensity, MDF, magnetic susceptibility, and Q-ratio.
T10. Paleomagnetic Units A1-A4 and B1-B18.
T11. Mean inclination, 95% confidence angle, precision parameter, ASD, and paleolatitude.
T12. Index properties data.
T13. P-wave velocity.
T14. Thermal conductivity values.
![]() Figures F1-F50
Figures F1-F50
![]() Figures
F51-F77
Figures
F51-F77
![]() Tables
T1-T14
Tables
T1-T14