![]() Figures F1-F50
Figures F1-F50
![]() Figures
F51-F100
Figures
F51-F100
![]() Figures
F101-F150
Figures
F101-F150
![]() Tables
T1-T27
Tables
T1-T27
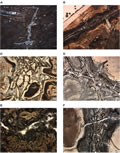
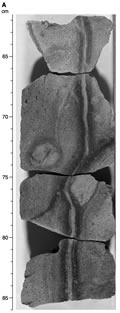
F101. Vein textures, Hole 1188A.
F102. Anhydrite-pyrite vein with a wide halo of bleaching.
F103. Diffuse silica-anhydrite-clay vein network and later anhydrite vein.
F104. Distribution of veins according to mineralogy, Hole 1188F.
F105. Distribution of vein mineralogy vs. lithologic units, Hole 1188F.
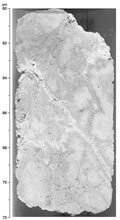
F106. Anhydrite-pyrite vein with a wide cyclic siliceous alteration halo.
F107. Anhydrite-pyrite veins, Hole 1188F.
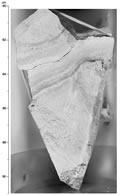
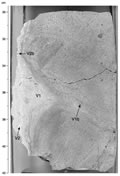
F108. Photograph and sketch of vein relationships in interval 193-1188F-14Z-1 (Piece 6, 98-110 cm).
F109. Crosscutting anhydrite vein structures.
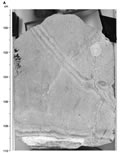
F110. Close-up photograph and sketch of interval 193-1188F-23Z-1 (Piece 3, 14-24 cm).
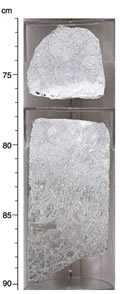
F111. Crack-seal quartz-pyrite vein.
F112. Close-up photograph and sketch of interval 193-1188F-43Z-1 (Pieces 2-3C, 62-86 cm).
F113. Summary of vein thicknesses and dips in Hole 1188F.
F114. Downhole chemical variations of selected major element oxides and trace elements, Holes 1188A and 1188F.
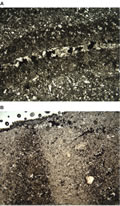
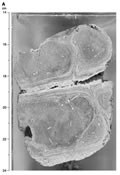
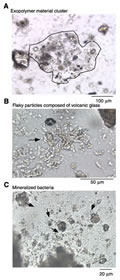
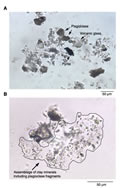
F115. Mineral particles showing bacterial habitation, Hole 1188A.
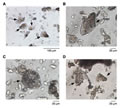
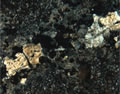
F116. Mineral particles showing possible bacterial habitation, Hole 1188A.
F117. Mineral fragments showing no bacterial habitation, Hole 1188F.
F118. Magnetic susceptibility.
F119. Natural gamma radiation.
F120. Compressional wave velocity.
F121. Thermal conductivity.
F122. Grain density.
F123. Porosity.
F124. Volume susceptibility.
F125. Remanent intensity, Hole 1188A.
F126. Magnetic susceptibility of minicore samples.
F127. Anisotropy of magnetic susceptibility.
F128. Natural remanent magnetization intensity of minicore samples.
F129. Stable inclination of minicore samples.
F130. Zijderveld plots and intensity-decay curves of two samples, Hole 1188A.
F131. Zijderveld plot and intensity-decay curve of a sample from Hole 1188A with stony secondary magnetization.
F132. Intensity of impulse isothermal remanent magnetization, Hole 1188A.
F133. Intensity of isothermal remanent magnetization, Hole 1188F.
F134. Intensity of back-field isothermal remanent magnetization, Hole 1188F.
F135. Thermal demagnetization curves for representation samples from Hole 1188A of isothermal remanent magnetization.
F136. Intensity of isothermal remanent magnetization after thermal demagnetization, Hole 1188A.
F137. CBTT temperature measurements obtained while drilling Core 193-1188A-4R in the Snowcap hydrothermal site.
F138. Temperature measurements, Hole 1188B.
F139. Log curves obtained from the resistivity-at-the-bit tool, Hole 1188B.
F140. Preliminary interpretation of the logging curves from the resistivity-at-the-bit tool.
F141. Covariation of electrical resistivity vs. gamma ray.
F142. Images of the deep resistivity from the resistivity-at-the-bit tool.
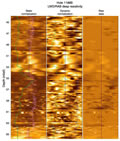
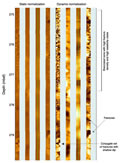
F143. Detail color image of deep resistivity between 18.7 and 32 mbsf using a static normalization technique.
F144. Heave measurements recorded with the guideline tensionometer encoder during the second and third wireline run, Hole 1188F.
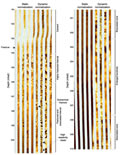
F145. Overview of the wireline logs, Hole 1188F.
F146. Temperatures recorded in Hole 1188F during wireline logging operations and with the UHT-MSM temperature probe.
F147. Temperatures recorded in Hole 1188F during deployment of the WSTP.
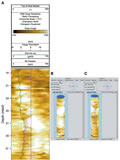
F148. FMS images showing a 19-m interval immediately below the 10.75-in casing shoe in Hole 1188F.
F149. An FMS section of Hole 1188F showing numerous fracture patterns and brecciation within logging Unit 6.
F150. The bottommost part of the Hole 1188F showing the best FMS images of the entire logged interval.

![]() Figures F1-F50
Figures F1-F50
![]() Figures
F51-F100
Figures
F51-F100
![]() Figures
F101-F150
Figures
F101-F150
![]() Tables
T1-T27
Tables
T1-T27